GBP/USD Price Analysis: Bears move in below counter trendline resistance, eye 1.1020 and 1.0900
- GBP/USD's confluence of resistance is playing into the nads of the bears at the start of the week.
- A break of the trendline support could be a key feature for the opening sessions.
The bears are emerging from a confluence of resistance on the long-term charts that is forcing the price out of last Wednesday's rally that petered out on Friday at around 1.1235. The following illustrates the prospects of a significant sell-off for the start of the week so long as the US dollar index can find support from a recovery in US yields.
DXY and 10-year yield analysis
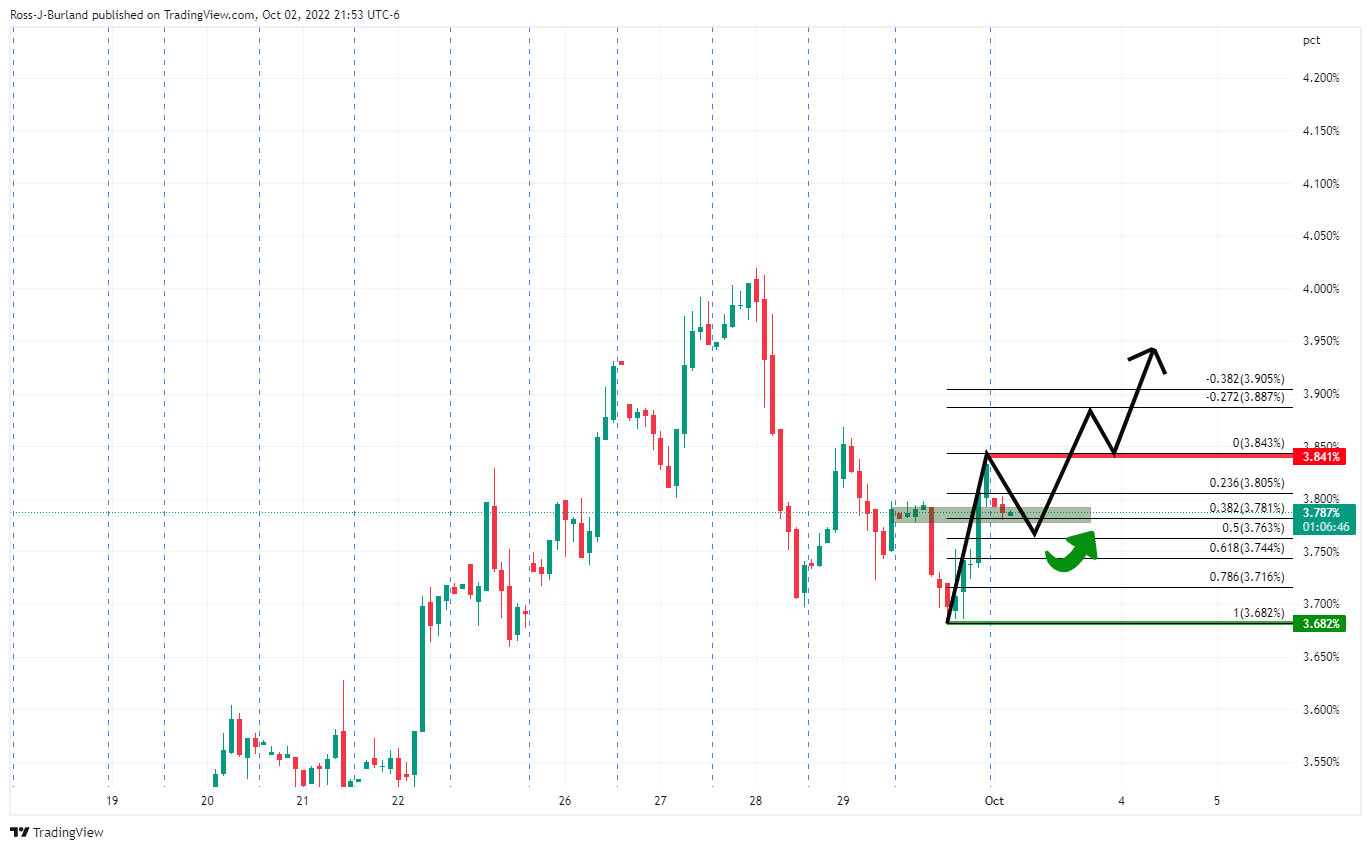
The 10-year yield which has taken a bit of a knock could be on the verge of a move up following the correction that has already started to decelerate into a 38.2% Fibonacci area of the prior bullish hourly leg. If this were to pan-out in the first sessions of the week, then that would bode well for the US dollar and the bearish thesis for GBP/USD.
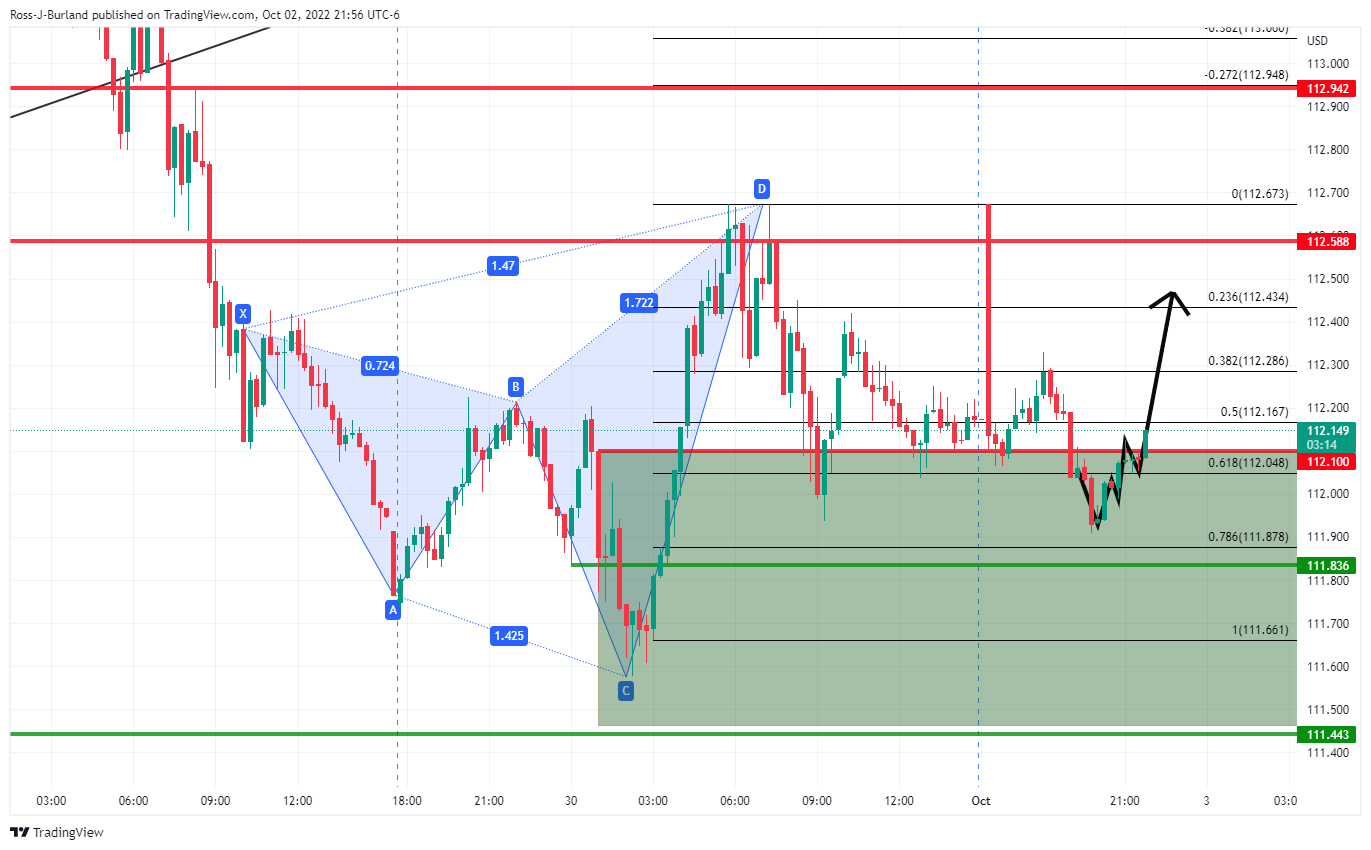
The DXY has formed a 15-min W-pattern and the price retested the neckline that subsequently acted as support, leading to the current bullish impulse that could find some legs into Frankfurt and beyond, solidifying the case for a blow-off to the downside in cable:
GBP/USD H1 chart
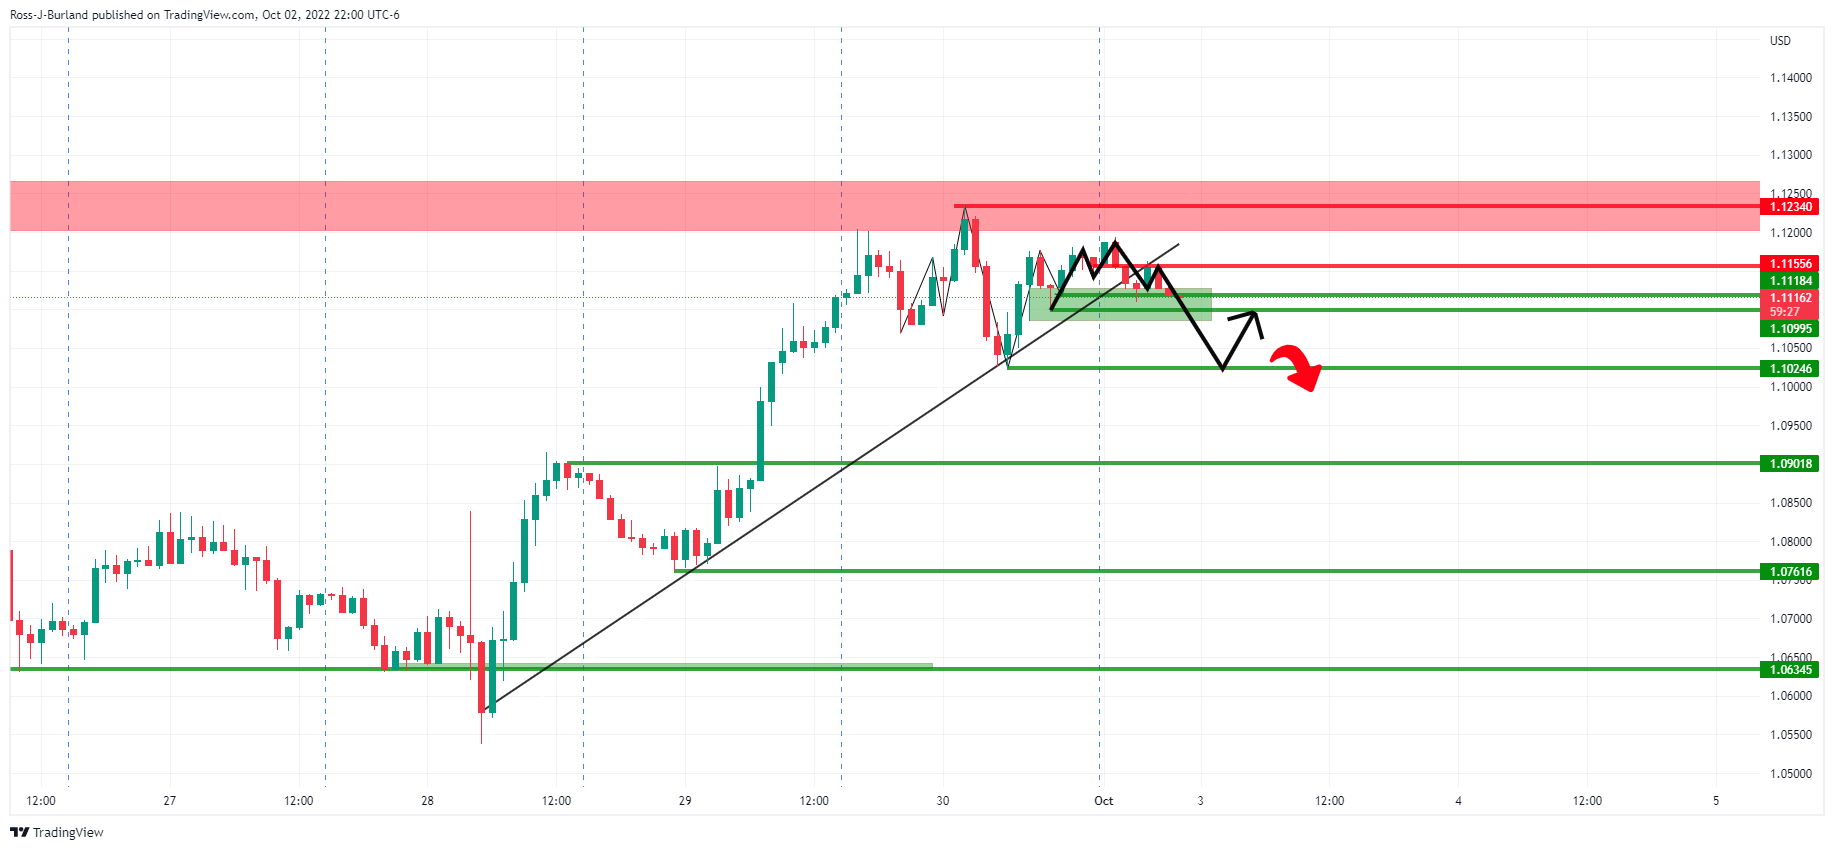
The price rose from Wednesday's lows of the week in three levels of rise across to Friday's high. This could lead to a sharp correction for the start of the week with a 1.0900 target on a break of 1.1020.
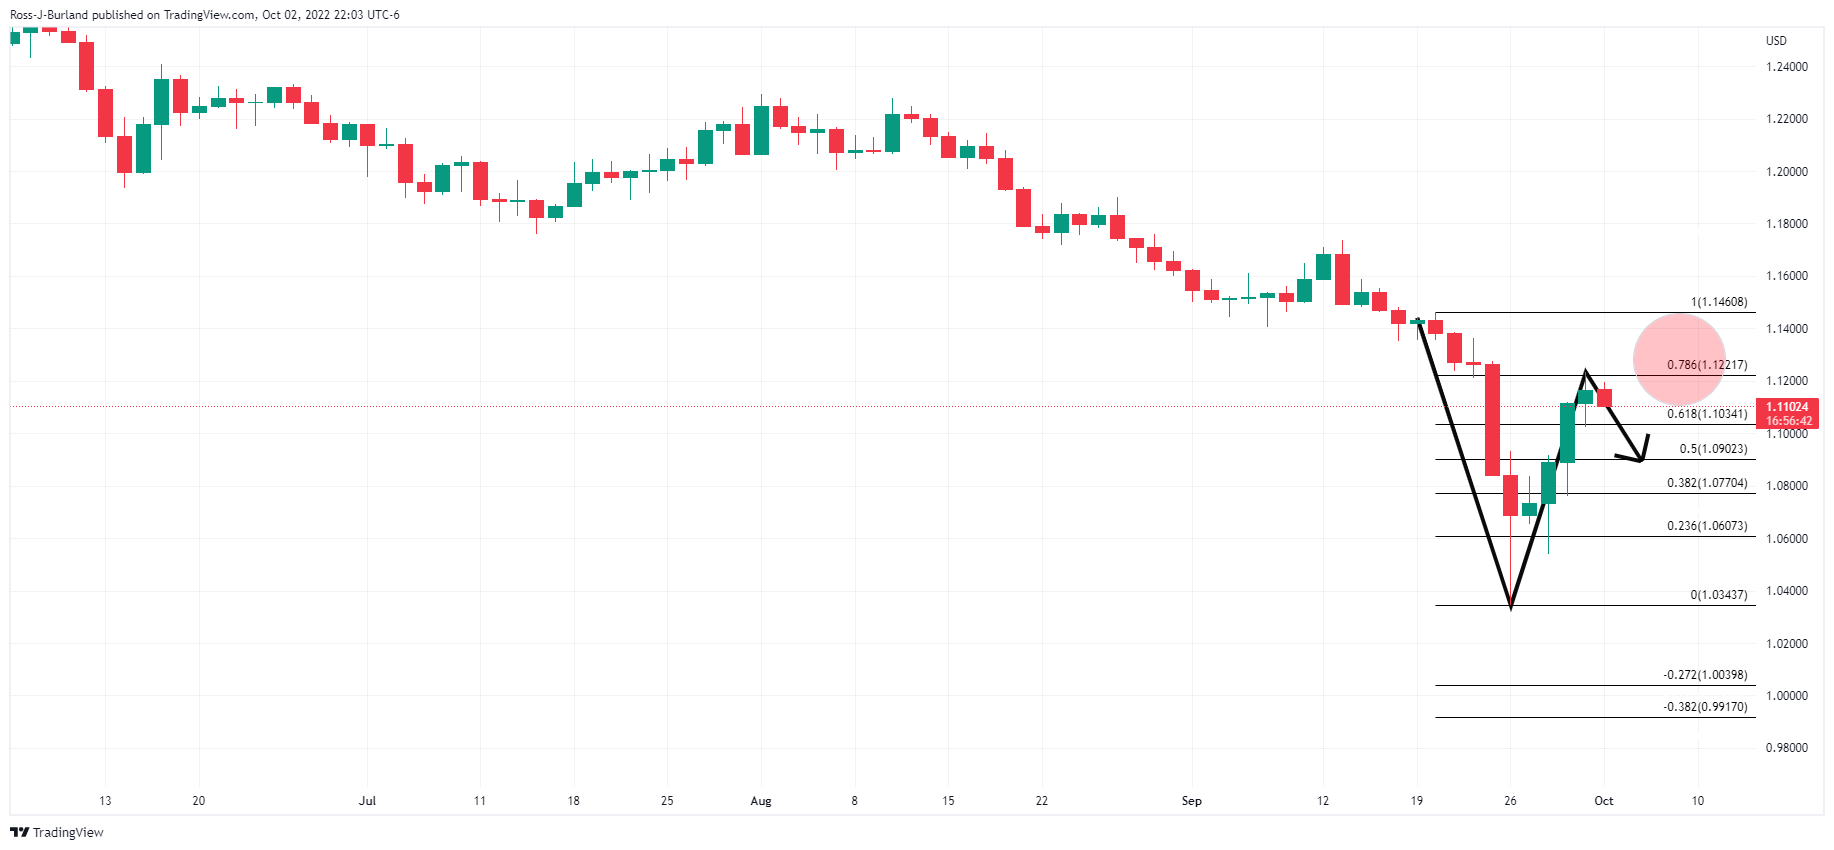
There is also a confluence of resistance on the weekly and daily charts as follows:
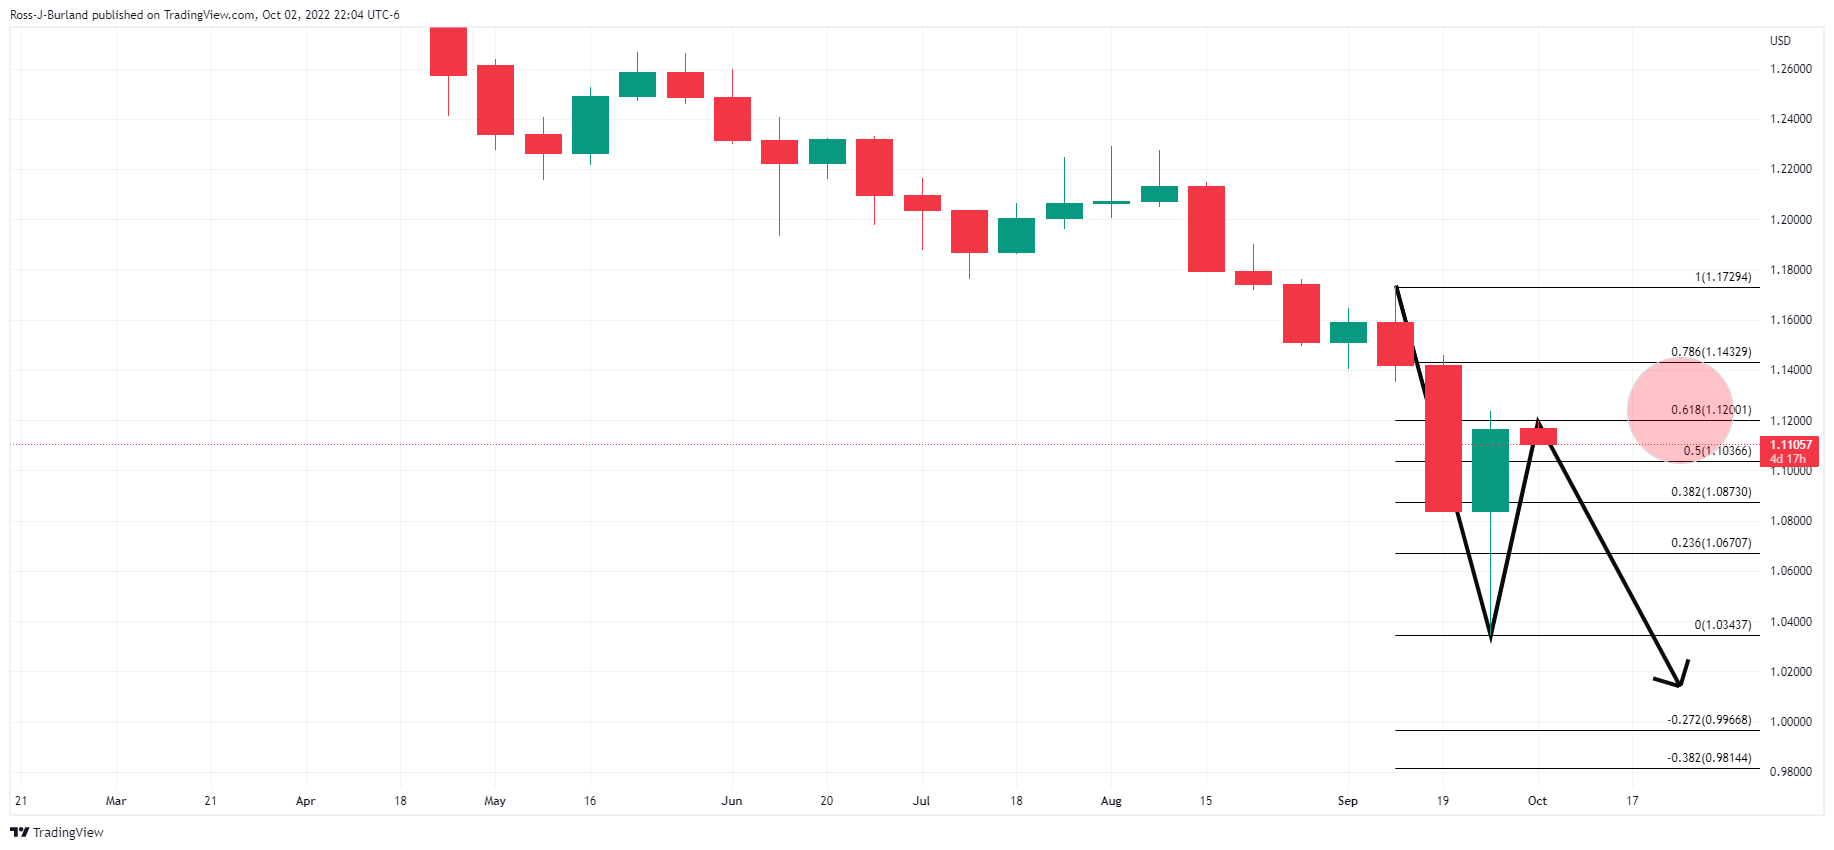
The confluence of the 78.6% and and 61.8% Fibonaccis are aligned at the same spot!