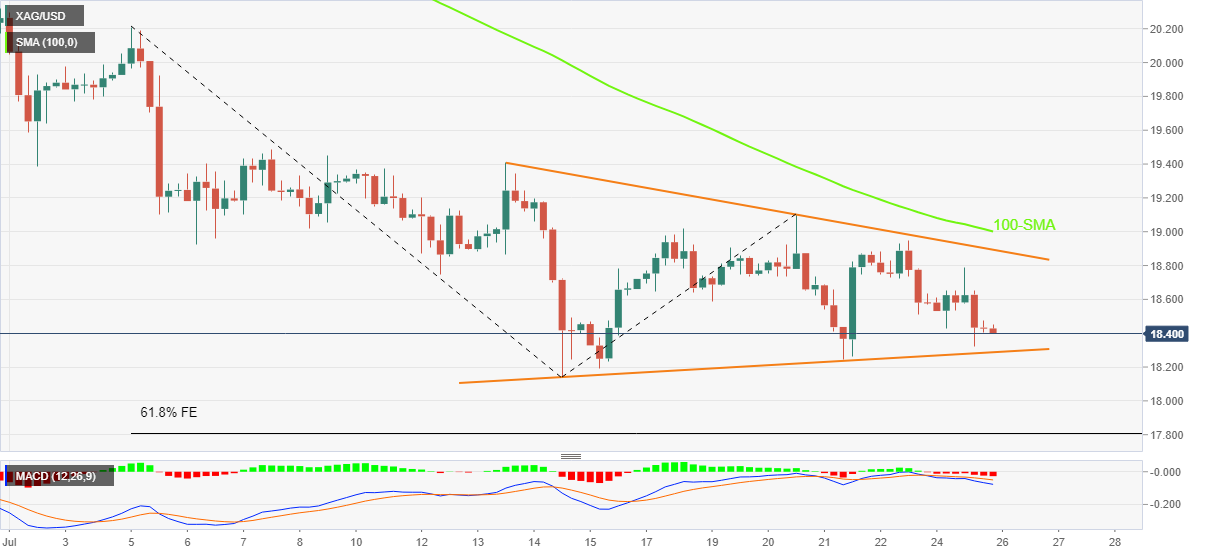
Silver Price Analysis: XAG/USD drops towards $18.00 inside fortnight-old triangle
- Silver remains pressured for the third consecutive day inside short-term symmetrical triangle.
- Bearish MACD signals, sustained trading below 100-SMA keep sellers hopeful.
- Mid-month high, 61.8% FE act as extra filters to trade.
Silver price (XAG/USD) remains depressed at around $18.40 inside a two-week-old symmetrical triangle. That said, the bright metal recently approaches the stated triangle’s support line.
Given the bearish MACD signals and the quote’s successful trading below the 100-SMA, XAG/USD is likely to witness further downside.
That said, the triangle’s lower line, around $18.25, appears the immediate support to watch for the metal traders.
Following that, the $18.00 threshold and the 61.8% Fibonacci Expansion (FE) of July 05-20 moves, near $17.80, could challenge silver bears.
In a case where the XAG/USD prices remain weak past $17.80, the odds of witnessing a south-run towards the June 2020 low near $16.95 can’t be ruled out.
Alternatively, the aforementioned triangle’s upper line, around $18.90, precedes the $19.00 round figure, also comprising the 100-SMA, which restricts the XAG/USD pair’s short-term upside moves.
If the silver buyers keep reins past $19.00, the mid-July swing high near $19.40 and the $20.00 psychological magnet will be on their radars afterward.
Overall, silver remains pressured around a multi-month low but the short-term triangle may restrict immediate moves.
Silver: Four-hour chart

Trend: Further weakness expected
