US Dollar Index Price Analysis: DXY remains on the way to 100.00
- DXY bulls take a breather around 22-month high.
- Clear break of weekly descending trend line, successful trading above 50-SMA joins bullish MACD signals to favor bulls.
- 100-SMA adds to the downside filters, 61.8% FE level lures the buyers.
Having reported a five-week uptrend to poke May 2020 highs, the US Dollar Index (DXY) begins the current week on a back foot as sellers attack 99.00 level during Monday’s Asian session.
Even so, the greenback gauge holds onto the previous day’s upside break of a descending trend line from March 07, which in turn keeps buyers hopeful.
On the same line are the bullish MACD signals and sustained trading beyond the 50-SMA.
Hence, the latest pullback remains elusive until breaking the previous resistance line, near 98.85 by the press time.
Following that, the 50-SMA and the recent lows, respectively near 98.40 and 97.70, may test the US Dollar Index bears before directing them to the 100-SMA level surrounding 97.40.
Meanwhile, further upside will aim for the latest multi-month high of 99.41 ahead of the 61.8% Fibonacci Expansion (FE) of February-March moves, surrounding the 100.00 psychological magnet.
In a case where DXY bulls dominate past 100.00, multiple tops marked during early 2020 around 100.50-55 will be on their radars.
DXY: Four-hour chart
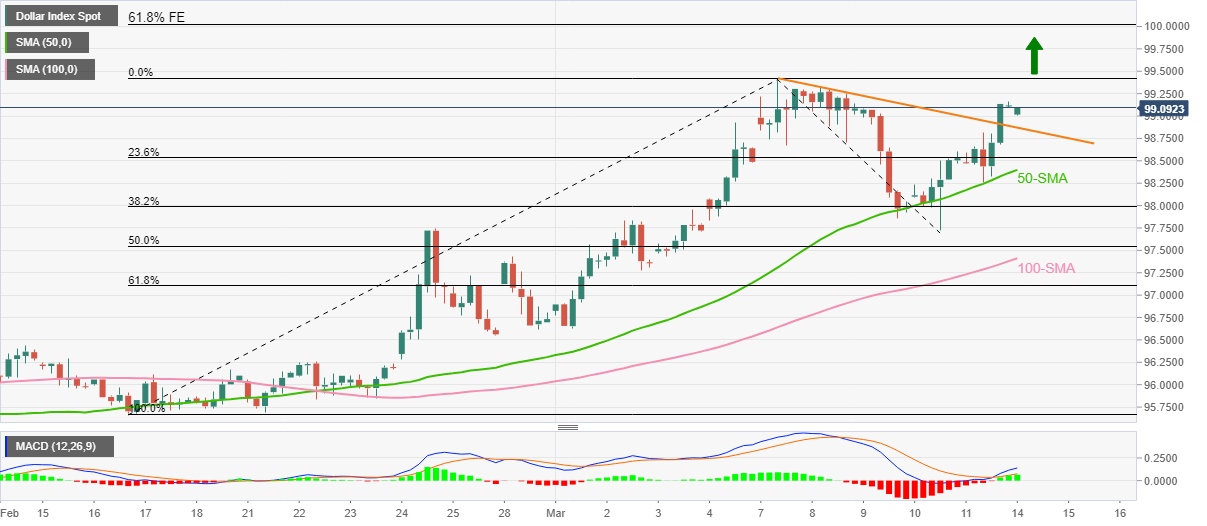
Trend: Further upside expected