GBP/JPY Price Analysis: Bears waiting on a break of 154.45
- GBP/JPY bears are lurking in a critical stage of the bull's correction.
- The daily 61.8% Fibonacci level is calling but a break of 154.45 will be critical to the downside.
GBP/JPY has been correcting the daily bearish impulse since the end of January's business. The daily correction has been uninterrupted, to date since January 24.
The price has rallied all the way into the 50% mean reversion area and has sights on the 61.8% target near 155.40 with little let-up in the pound's strength. The following illustrates the daily market structure and also where the price will need to break on a 4-hour time frame basis for bears to be in for a running.
GBP/JPY daily chart
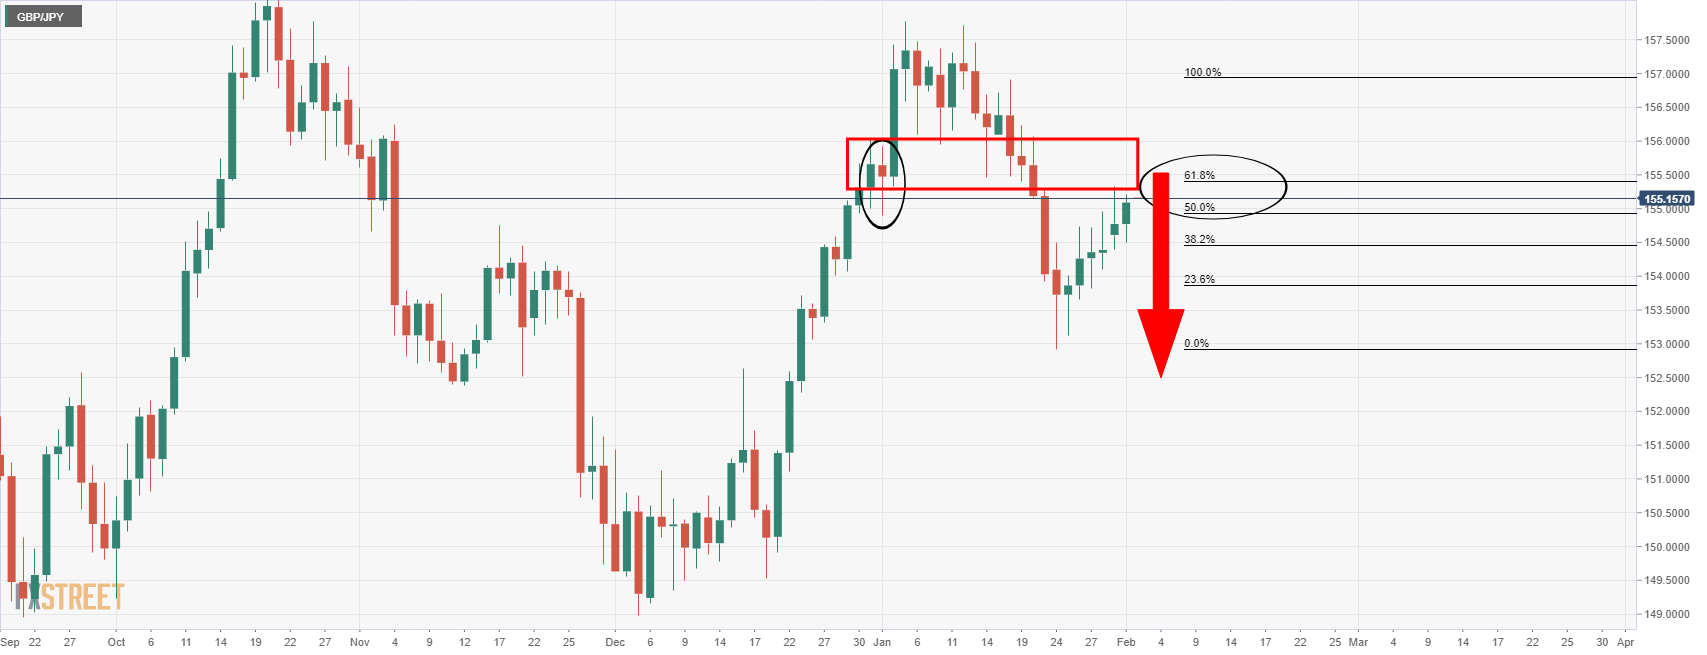
As illustrated, the old order block of January 3 is a compelling area on the chart that meets with the 61.8% and 50% ratios. This could equate to a firm area of resistance and if so, bears will start to monitor for bearish structure on the lower time frames as follows:
GBP/JPY H4 chart
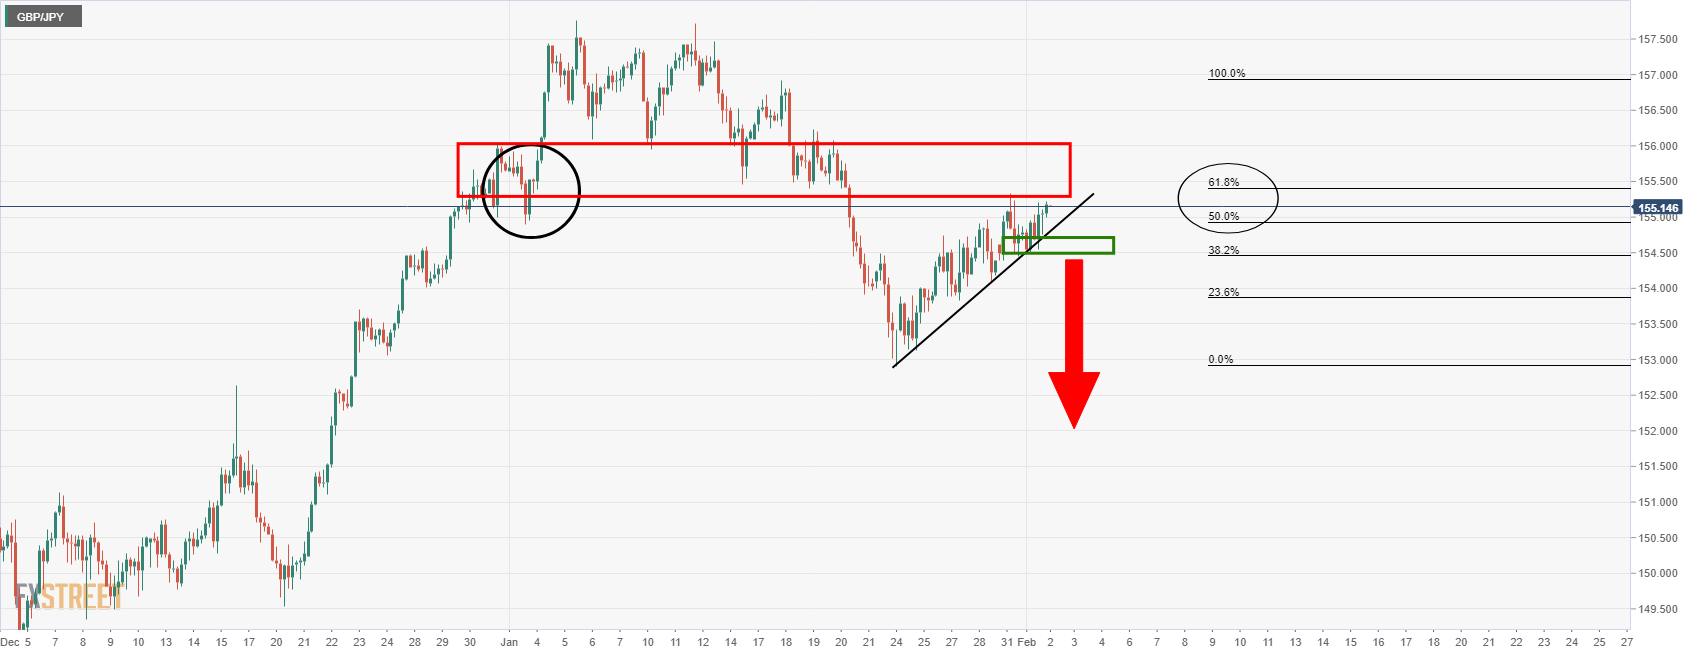
Should the price manage to break the current support block, then there will be expectations of a drive to the downside and below the dynamic and horizontal support as illustrated above. 154.45 is ket in this regard.