US Dollar Index Price Analysis: DXY grinds higher past 93.00 amid mixed technical signals
- DXY struggles for a clear direction around the monthly top.
- Two-month-old horizontal support defends bulls, monthly top guards immediate upside.
US Dollar Index (DXY) consolidates recent losses, grinds higher around 93.22 during Wednesday’s Asian session.
The greenback gauge portrays the traders’ indecision on a key day after witnessing mixed signals from the previous two days’ candlesticks.
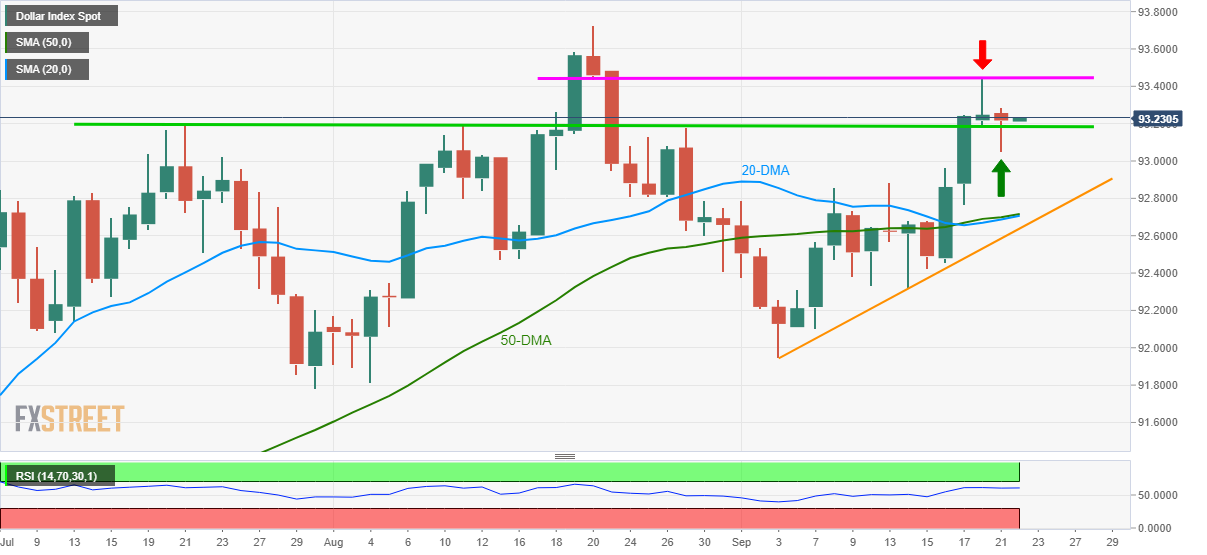
Also challenging the DXY moves is the monthly horizontal line and an area comprising multiple levels marked since late July.
Even so, firmer RSI and sustained trading beyond the key moving averages, as well as a three-week-old rising trend line, keeps US Dollar Index bulls hopeful.
That said, the quote needs to overcome the immediate hurdle comprising the recent high and the August 20 low, near 93.45, to poke the yearly top surrounding 93.72.
On the contrary, a downside break of the 93.20-18 nearby support zone will direct the DXY bears to the early month peak close to 92.88.
However, a convergence of 20 and 50-DMA near 92.70 will challenges the gauge’s further downside ahead of a short-term support line around 92.63.
DXY: Daily chart
Trend: Further upside expected