US Dollar Index Price Analysis: DXY restores the run-up to 93.20
- DXY regains above 50-DMA after crossing three-week-old resistance line.
- Firmer RSI directs the bulls towards the key horizontal hurdle.
- Ascending trend line from June, 100-DMA adds to the downside filters.
US Dollar Index (DXY) stays on the front foot around a two-week top, near 92.70 during Thursday’s Asian session.
The greenback gauge jumped to the multi-day top after regaining its place beyond 50-DMA, following the break of a short-term descending trend line resistance.
With the RSI line backing the upside momentum, the DXY is likely rising towards a seven-week-old horizontal hurdle resistance area near 93.20. However, the latest high near 92.85 and the 93.00 threshold may offer intermediate halts during the advances.
It’s worth noting that a clear run-up beyond 93.20 won’t hesitate to challenge the yearly peak surrounding 93.72.
Meanwhile, pullback moves will have 50-DMA and the resistance-turned-support, respectively around 92.60 and 92.30, as nearby challenges.
Following that an ascending trend line from June 23, close to 92.05, will precede the 100-DMA level of 91.68 to challenge the US Dollar Index bears.
DXY: Daily chart
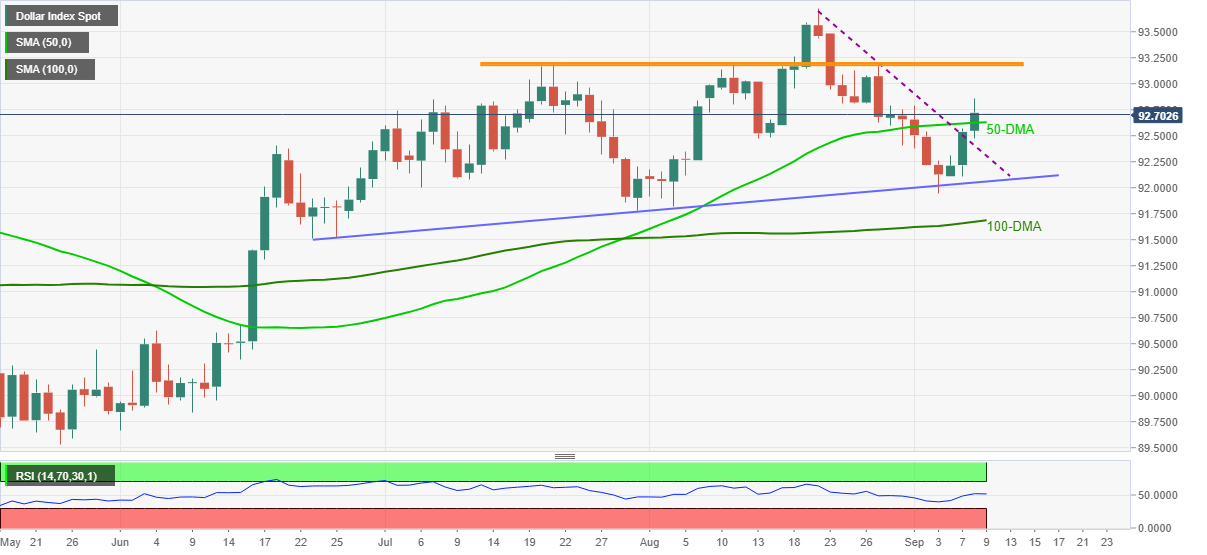
Trend: Further upside expected