US Dollar Index Price Analysis: Recovery moves battle 92.50 on the Fed day
- DXY holds onto bounce off three-week-old support line.
- Momentum defends weekly trend line breakout, directing bulls to 100-SMA.
- Short-term resistance line, 200-SMA add to the trading filters.
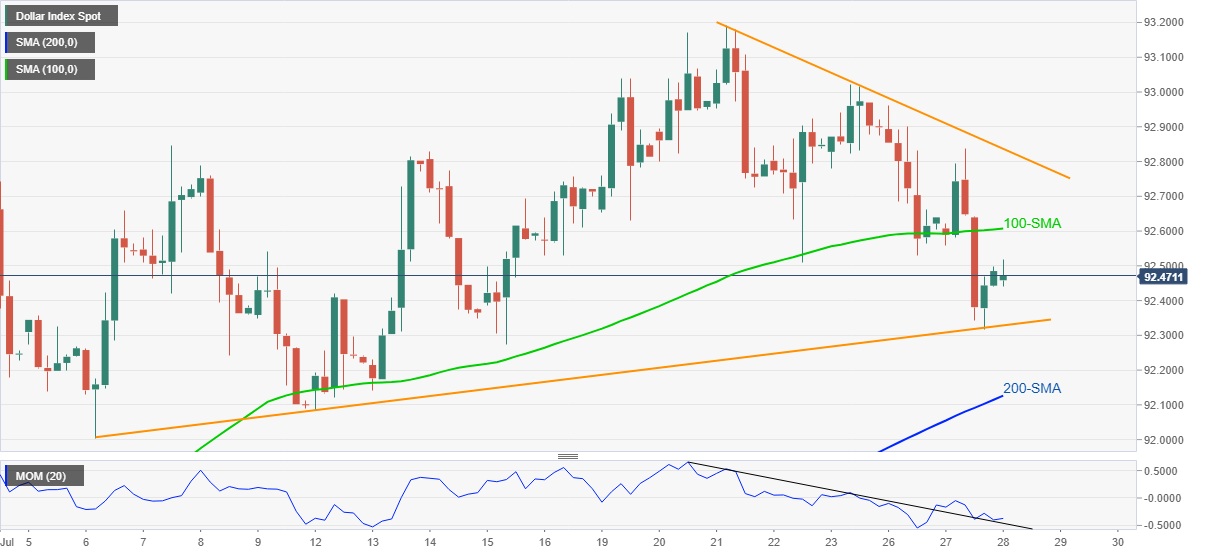
US Dollar Index (DXY) consolidates the weekly losses, flirts with an intraday top around 92.50, amid early Wednesday. In doing so, the greenback gauge justifies the market’s cautious mood ahead of the US Federal Open Market Committee (FOMC) verdict while keeping the bounce off a short-term support line.
As the Momentum line keeps Friday’s trend line breakout, the DXY is on the way to a 100-SMA level near 92.60.
However, any further advances will be tested by a one-week-old falling trend line resistance around 92.85 and the 93.00 threshold.
In a case where the US Dollar Index remains firmer past 93.00, the monthly high of 93.20 and the yearly peak surrounding 93.45-50 will be in focus.
On the contrary, a downside break of the nearby support line, at 92.30, will be questioned by the 200-SMA level of 92.12 before recalling the bears.
Following that, the monthly low near the 92.00 round figure and late June’s swing lows near 91.50 should lure the DXY bears.
DXY: Four-hour chart
Trend: Further recovery expected