Gold Price Forecast: XAU/USD is not out of the woods yet, levels to watch – Confluence Detector
- Gold price rebounds but bearish bias still persists amid upbeat mood.
- $1794 is the level to beat for the gold bears, focus on key events.
- Gold Weekly Forecast: Possible correction to $1,800 as key resistance holds.
Gold price is off the lows but remains under pressure amid a better market mood and rising Treasury yields, making the non-yielding gold less attractive. Treasury yields rebounded after the 20-year bond auction failed to find a decent response. Meanwhile, a broadly subdued US dollar helps keep a floor under gold price. The main event risk this Thursday remains the European Central Bank (ECB) monetary policy decision, the first after the new strategy, which could likely have a significant impact on gold price. The central bank is expected to make no changes to its interest rates but may pledge more stimulus to make good on the commitment to boost inflation. Dovish ECB outcome is likely to boost the risk sentiment further, keeping the yields elevated at gold’s expense.
Also, of note remains the US weekly Jobless Claims and other minority reports for fresh trading opportunities. Technically, gold price awaits acceptance below $1795 for unleashing additional downside.
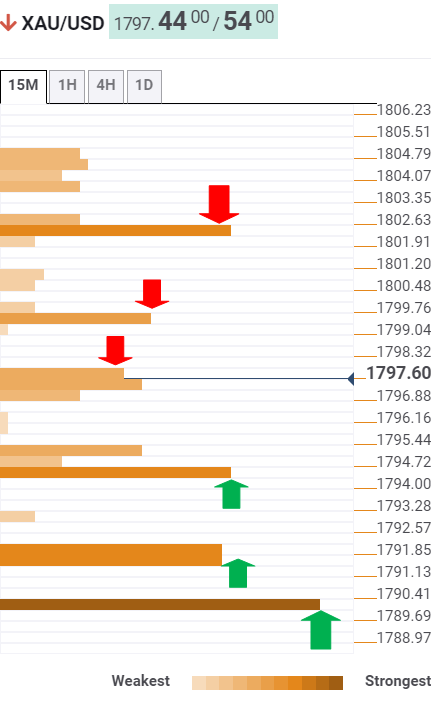
Gold Price: Key levels to watch
The Technical Confluences Detector shows that gold bears failed to find a foothold below strong support at $1794, which is the confluence of the SMA100 one-day and pivot point one-day S1.
Therefore, the bulls are seen fighting back control, looking to recapture the Fibonacci 23.6% one-day at $1800 if the $1798 barrier is taken out convincingly.
That level is the convergence of the previous low four-hour and Bollinger Band one-day Middle.
Should the buying interest sustain gold price could challenge the next hurdle at $1802, the intersection of the SMA5 four-hour and Fibonacci 38.2% one-day.
Alternatively, if the rebound falters, the abovementioned key support at $1794 could be put to test once again.
A firm break below the latter could expose the $1791 cap, which is the meeting point of the previous week’s low and pivot point one-week S1.
A powerful support of Fibonacci 23.6% one-week at $1789 will challenge the bearish commitments.
Here is how it looks on the tool
About Technical Confluences Detector
The TCD (Technical Confluences Detector) is a tool to locate and point out those price levels where there is a congestion of indicators, moving averages, Fibonacci levels, Pivot Points, etc. If you are a short-term trader, you will find entry points for counter-trend strategies and hunt a few points at a time. If you are a medium-to-long-term trader, this tool will allow you to know in advance the price levels where a medium-to-long-term trend may stop and rest, where to unwind positions, or where to increase your position size.