Silver Price Analysis: 21/50-day EMA probe inverted hammer on daily chart
- Silver prices refresh intraday high following Monday’s bullish candlestick.
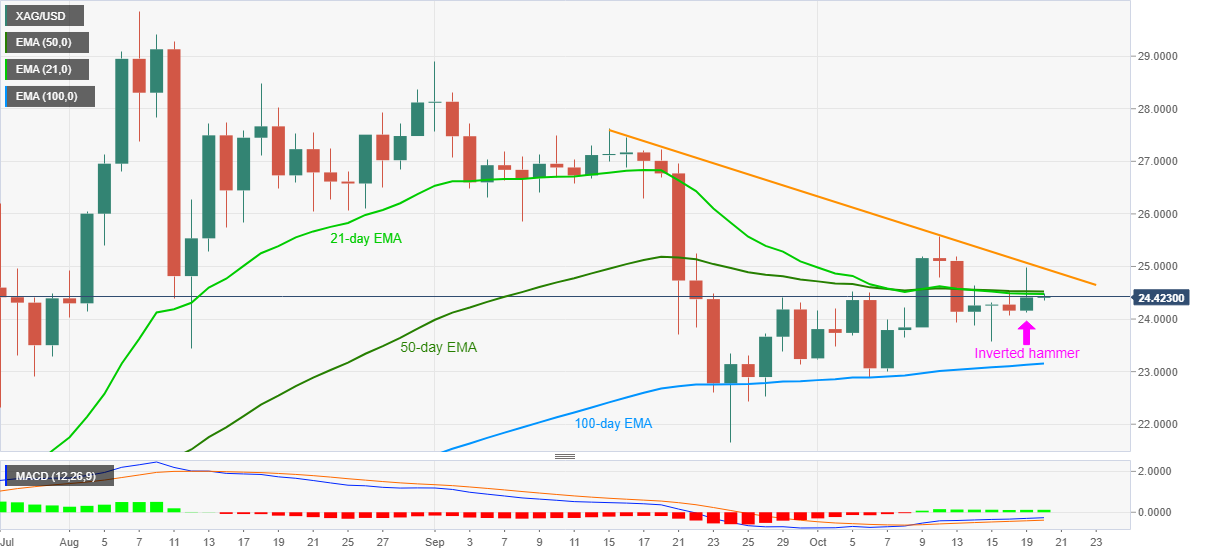
- A confluence of 21-day and 50-day EMA precede one-month-old falling trend line to challenge buyers.
- 100-day EMA offers strong support, $24.00 can entertain short-term sellers.
Silver picks up the bids near $24.46, an intraday high of $24.49, during the early Tuesday. While flashing mild gains, the bullion justifies the previous day’s bullish candlestick formation amid an upbeat MACD histogram. However, a joint of 21-day and 50-day EMA questions the bulls around $24.50.
Even if the quote manages to cross the $24.50 immediate resistance confluence, a downward sloping trend line from September 15, at $25.00 now, will raise bars for Silver buyers’ entries.
It should, however, be noted that the metal’s ability to piece the $25.00 round-figure will enable it to refresh the monthly top surrounding $25.55.
Meanwhile, a downside break of $24.11, marking Monday’s low, will defy the bullish candle and can recall the $24.00 round-figure on the chart.
However, silver sellers are less likely to get convinced unless breaking the 100-day EMA level of $23.15.
Silver daily chart
Trend: Pullback expected