Back
15 Oct 2020
EUR/USD Price Analysis: Market turns indecisive
- EUR/USD's daily chart shows indecision in the market.
- A close below Wednesday's low would imply a bearish breakdown.
EUR/USD is currently trading marginally higher on the day near 1.1752.
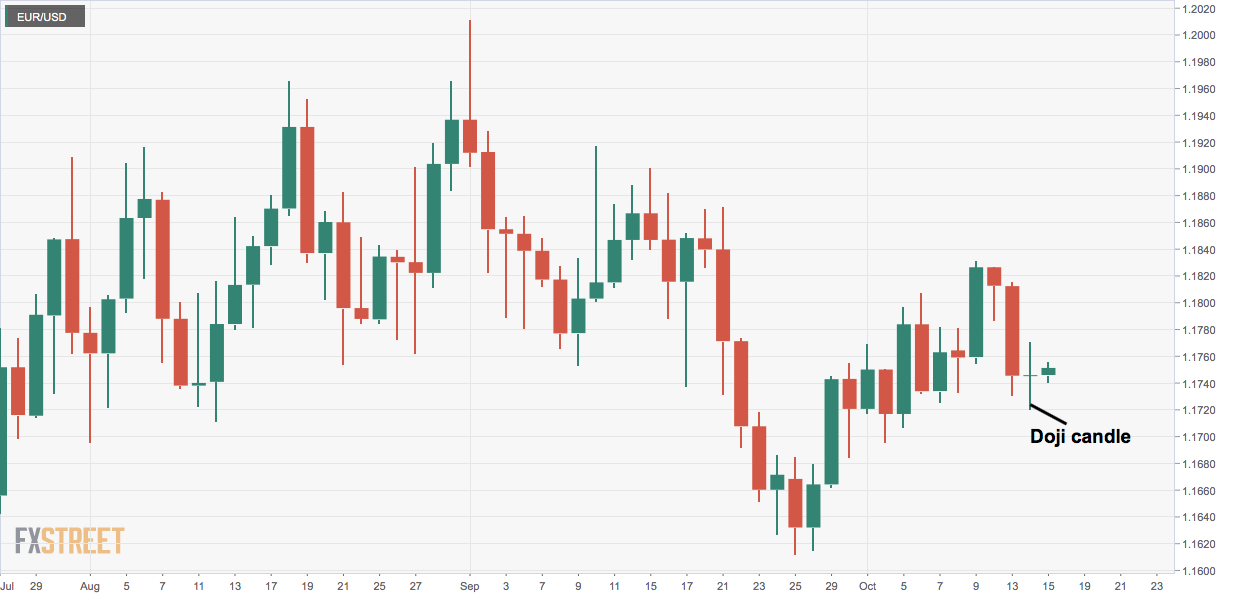
On Wednesday, the pair witnessed two-way business before printing a flat close, creating a classic Doji candle on the daily chart.
The Doji represents indecision in the market place. As such, the immediate bias is neutral.
A move below the Doji candle's low of 1.1720 would mean the period of indecision has ended with a bear victory and could yield a re-test of the September low of 1.1612.
Alternatively, a close above the Doji candle's high of 1.1771 would confirm a bullish Doji reversal pattern. That said, more credible evidence of a breakout would be 1.1831 (Oct. 9 high).
Daily chart
Trend: Neutral
Technical levels