Gold Price Analysis: XAU/USD up 0.5% in Asia, but gains could be short-lived
- Gold's 4-hour chart shows the price boiunce from $1,863 has ended.
- Short-term charts favor a retest of the psychological support of $1,900.
Gold is currently trading around $1,937 per ounce, representing a 0.5% gain on the day.
The moderate gains seen at press time could be short-lived, as the US dollar, the biggest nemesis of gold, is witnessing an oversold bounce. The greenback picked up a bid on Wednesday after Federal Reserve’s July meeting minutes dashed hopes for additional measures like yield curve control.
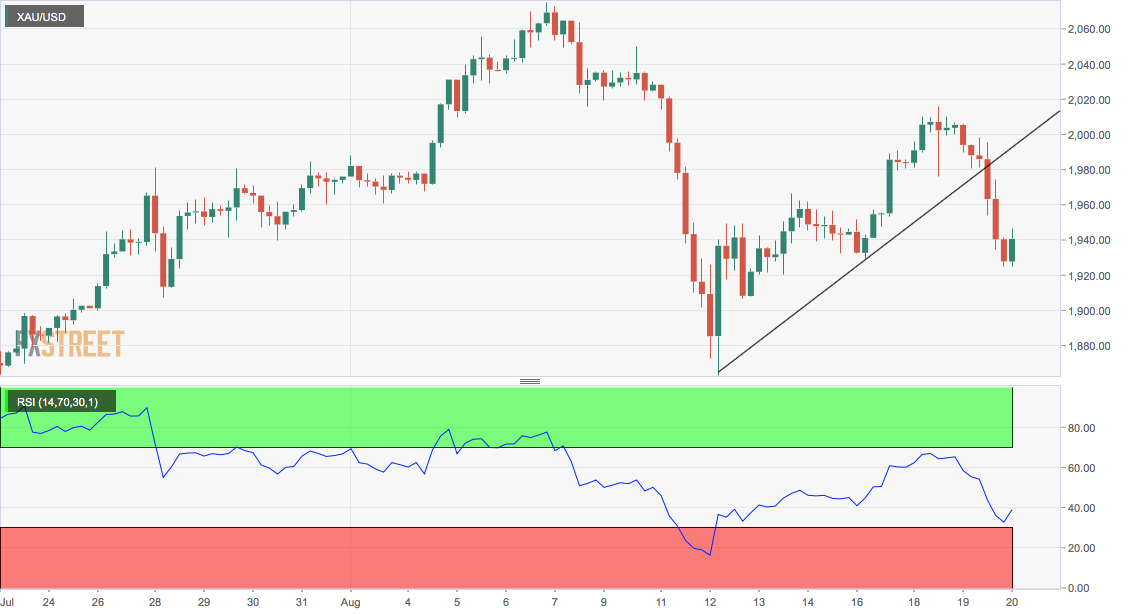
In addition, short duration charts have turned bearish, courtesy of Wednesday’s 3.67% decline, which violated the trendline rising from Aug. 12 and Aug. 16 lows. The downside break of the trendline is backed by a below-50 or bearish reading on the 4-hour chart relative strength index (RSI) and indicates that the bounce from the recent low of $1,863 has ended.
Wednesday’s drop has also established a lower high on the daily chart – the first since September 2019.
The odds, therefore, appear stacked in favor of decline to the psychological support of $1,900, which, if breached, would expose the low of $1,863 reached on Aug. 12. On the higher side, the newly created lower high of $2,015 is the level to beat for the bulls.
Daily chart
Trend: Bearish
Technical levels