US Dollar Index drops to lows near 93.10, looks to data
- DXY extends the leg lower to the 93.20 area on Thursday.
- US politics and the coronavirus aid bill remain in centre stage.
- Weekly Claims, Export/Import Prices next on the calendar.
The greenback is seeing its downside accelerated on Thursday and testing new 4-day lows in the 93.20/15 band when gauged by the US Dollar Index (DXY).
US Dollar Index looks to data, politics
The index is down for the second session in a row in the second half of the week, trading in multi-day lows and approaching the oversold territory, as per the daily RSI. On the other hand, the upside in DXY remains well capped by the 94.00 neighbourhood.
In the meantime, US lawmakers remain unable to unlock the deal over another stimulus package, motivating political uncertainty to keep growing and weighing on the buck.
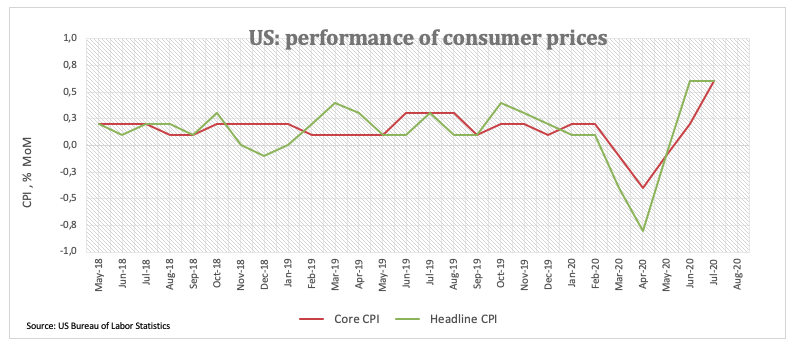
The sell-off in the greenback comes despite July’s higher-than-expected inflation figures – tracked by the CPI and released on Wednesday - and the recent ascent in yields of the 10-year benchmark to multi-week highs around 0.70%.
Later in the NA session, the usual Initial Claims should grab all the attention seconded in relevance by Import/Export Prices.
What to look for around USD
The index stays on the defensive after being rejected once again from the 94.00 region earlier in the week. Looking at the broader picture, investors remain bearish on the dollar against the usual backdrop of a dovish Fed, the unabated advance of the pandemic and somewhat diminishing momentum in the economic recovery, whereas persistent US-China effervescence appears on the supportive side of the greenback. On another front, the speculative community remained well into the negative territory for yet another week, supporting the view that a serious bearish trend could be shaping up around the dollar.
US Dollar Index relevant levels
At the moment, the index is losing 0.35% at 93.10 and faces the next support at 92.52 (2020 low Aug.6) seconded by 91.80 (monthly low May 18) and finally 89.23 (monthly low April 2018). On the upside, a break above 93.99 (weekly high Aug.3) would aim for 94.20 (38.2% Fibo of the 2017-2018 drop) and then 96.03 (50% Fibo of the 2017-2018 drop).