WTI Price Analysis: 200-HMA is a tough nut to crack amid rising wedge breakdown
- WTI eyes $39 amid rising wedge breakdown on the hourly chart.
- 50-HMA limits the immediate downside, a minor bounce likely.
- 200-HMA is the level to beat for the bears amid bearish RSI.
WTI has bounced-off lows, still sheds over 1% to trade around $40.80, as the OPEC and its allies’ (OPEC+) decision to ease output cuts from next month weighs.
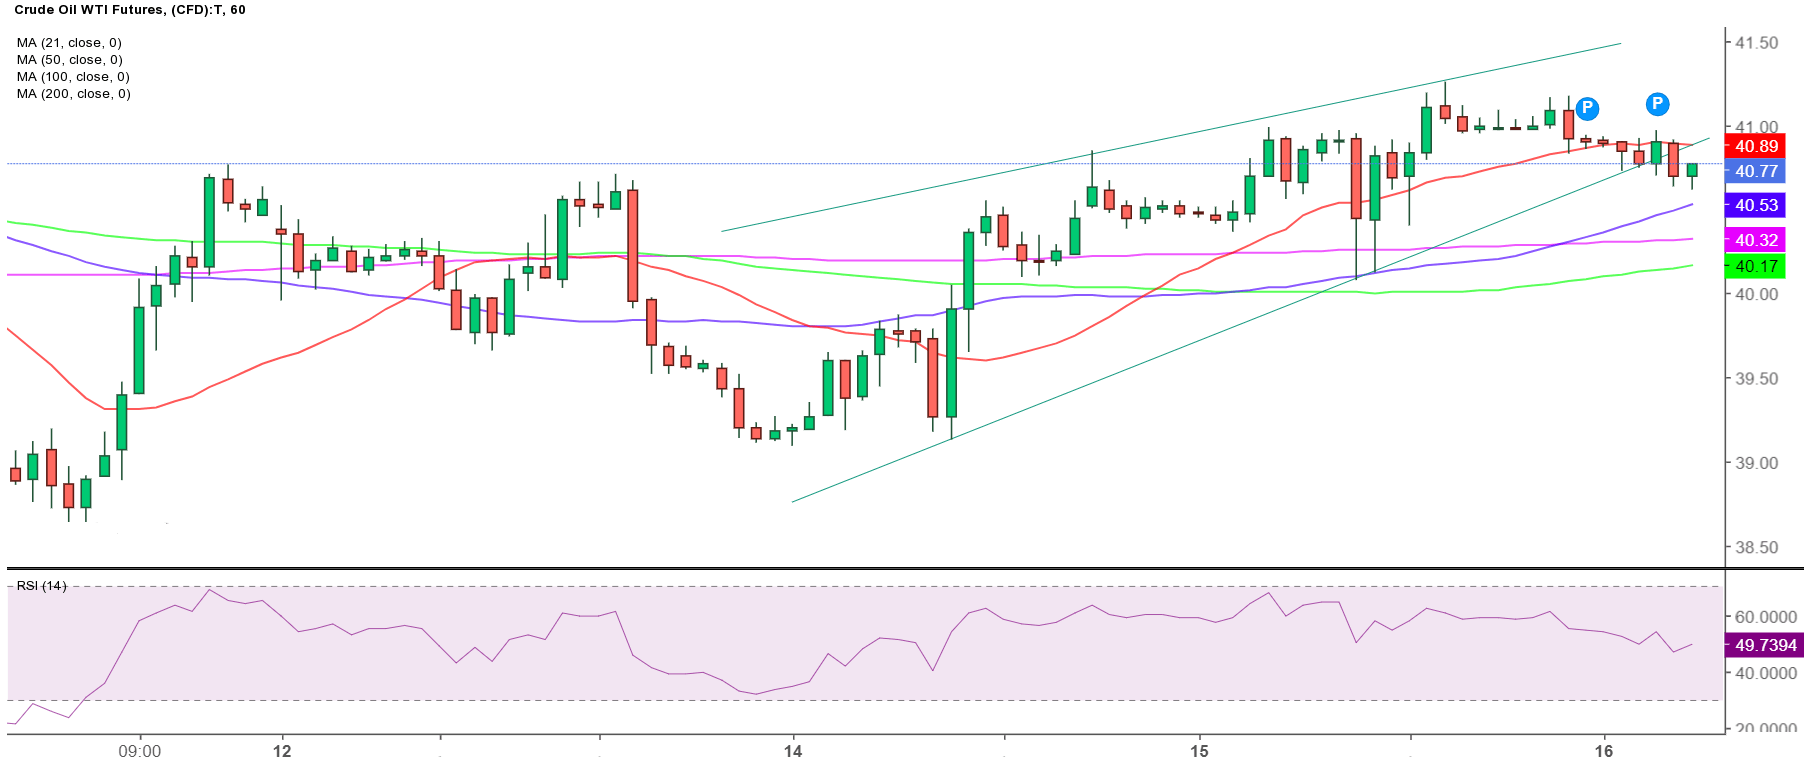
The black gold looks vulnerable even from a short-term technical perspective after the price charted a rising wedge breakdown on the hourly sticks in the last hour.
An hourly closing below the rising trendline support at $40.84 validated the formation. The breach of the 21-hourly Simple Moving Average (HMA) at $40.90 added to the credence. A test of the pattern target below the 39 level remains on the cards.
However, a bunch of healthy support levels are likely to test the bears’ commitment on their way to the pattern target. The immediate downside is likely to be capped by the 50-HMA at $40.52.
The next support awaits at the horizontal 200-HMA at $40.32, which is the critical level to beat for the bears.
Meanwhile, a minor bounce cannot be ruled out in the coming hour, as the hourly Relative Strength Index (RSI) has reversed from the bearish territory and looks to regain the 50 level. To the upside, strong resistance around $40.90 could keep the bounce in check.
All in all, the risks remain tilted to the downside in the barrel of WTI.
WTI: Hourly chart
WTI: Additional levels to watch