USD/INR Price Analysis: Steps back from five-day top to key SMAs
- USD/INR stays in a short-term symmetrical triangle.
- A confluence of 50 and 100-day SMA offer intermediate direction.
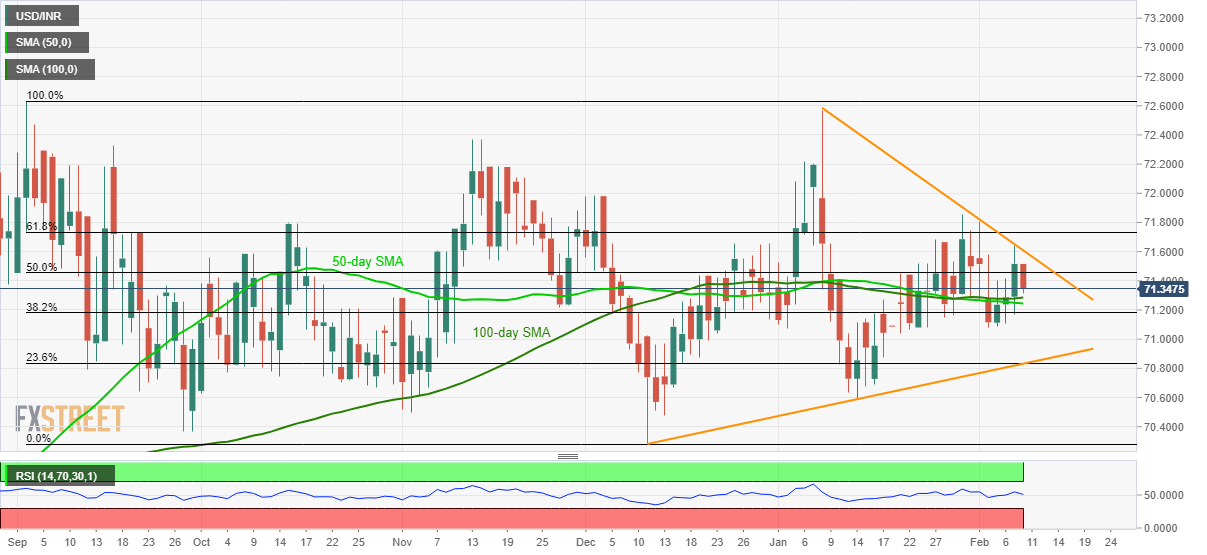
USD/INR declines to 71.34 amid the initial Indian session on Monday. In doing so, the pair snaps the three-day winning streak while also takes a U-turn from the monthly falling resistance line, forming part of the multi-day-old symmetrical triangle.
With this, the pair is likely to revisit a confluence of 50 and 100-day SMA confluence around 71.24/28 whereas the month’s bottom near 71.07 could question its further downside.
Should USD/INR prices remain soft below 71.07, the aforementioned triangle’s support line and 23.6% Fibonacci retracement of the pair’s September-December 2019 fall, around 70.80, will be the key level to watch.
On the contrary, the quote’s run-up beyond 71.60 resistance line can take aim at a 61.8% Fibonacci retracement level of 71.73.
However, 71.85, 72.00 and 72.20/22 will challenge the bulls during the post-71.73 run-up.
USD/INR daily chart

Trend: Sideways
FXStreet Indonesian Site - new domain!
Access it at www.fxstreet-id.com
