AUD/JPY Price Analysis: Positive beyond 21-day SMA
- AUD/JPY trades above 21-day SMA for the fifth day in a raw.
- 61.8% Fibonacci retracement guards immediate upside.
- 50% Fibonacci retracement, 200-day SMA can challenge sellers during the declines below 21-day SMA.
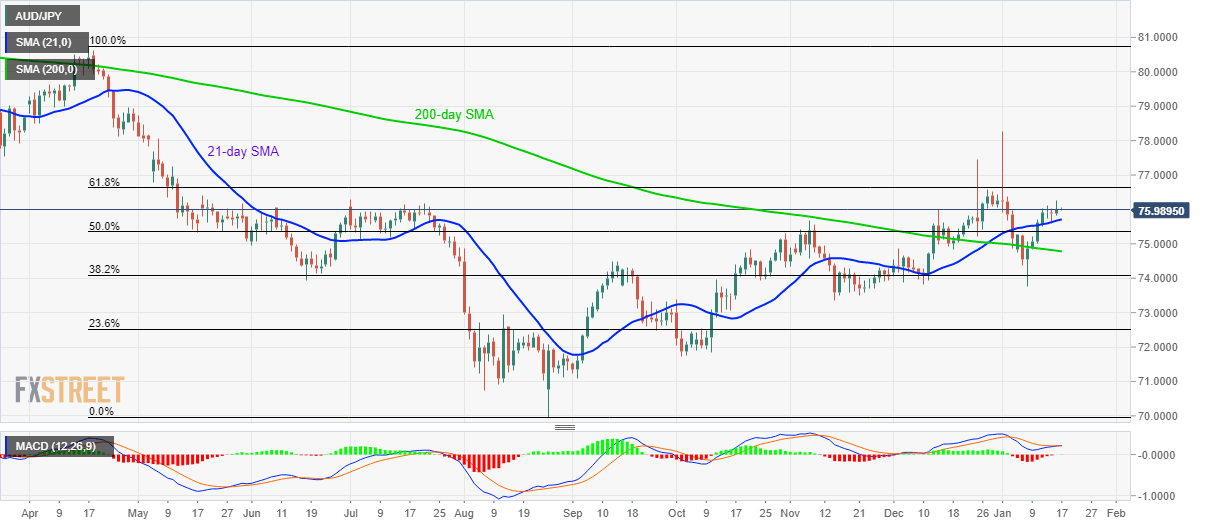
AUD/JPY buyers catch a breath around 76.00 during the early Asian morning on Friday. The pair registered gains the previous day, marking the sustained trading above 21-day SMA, but is yet to cross 61.8% Fibonacci retracement level of the pair’s declines from April 2019 to August 2019.
Hence, traders will want to look for a clear break of either 61.8% Fibonacci retracement level of 76.63 to target 77.00 round-figure or aim for 50% Fibonacci retracement, at 75.35, on the downside break of 21-day SMA, near 75.70 now.
Should prices stay positive above 77.00, early-May 2019 top close to 78.00 can offer intermediate halt to the pair’s rise to 78.50/55 and 79.00 numbers to the north.
Alternatively, a 200-day SMA level of 74.77 and the monthly bottom surrounding 73.75 can entertain sellers during the pair’s declines below 50% Fibonacci retracement level.
AUD/JPY daily chart
Trend: Sideways to positive