Back

2 Jan 2020
Gold Price Analysis: XAU/USD kicks off 2020 above $1500/oz
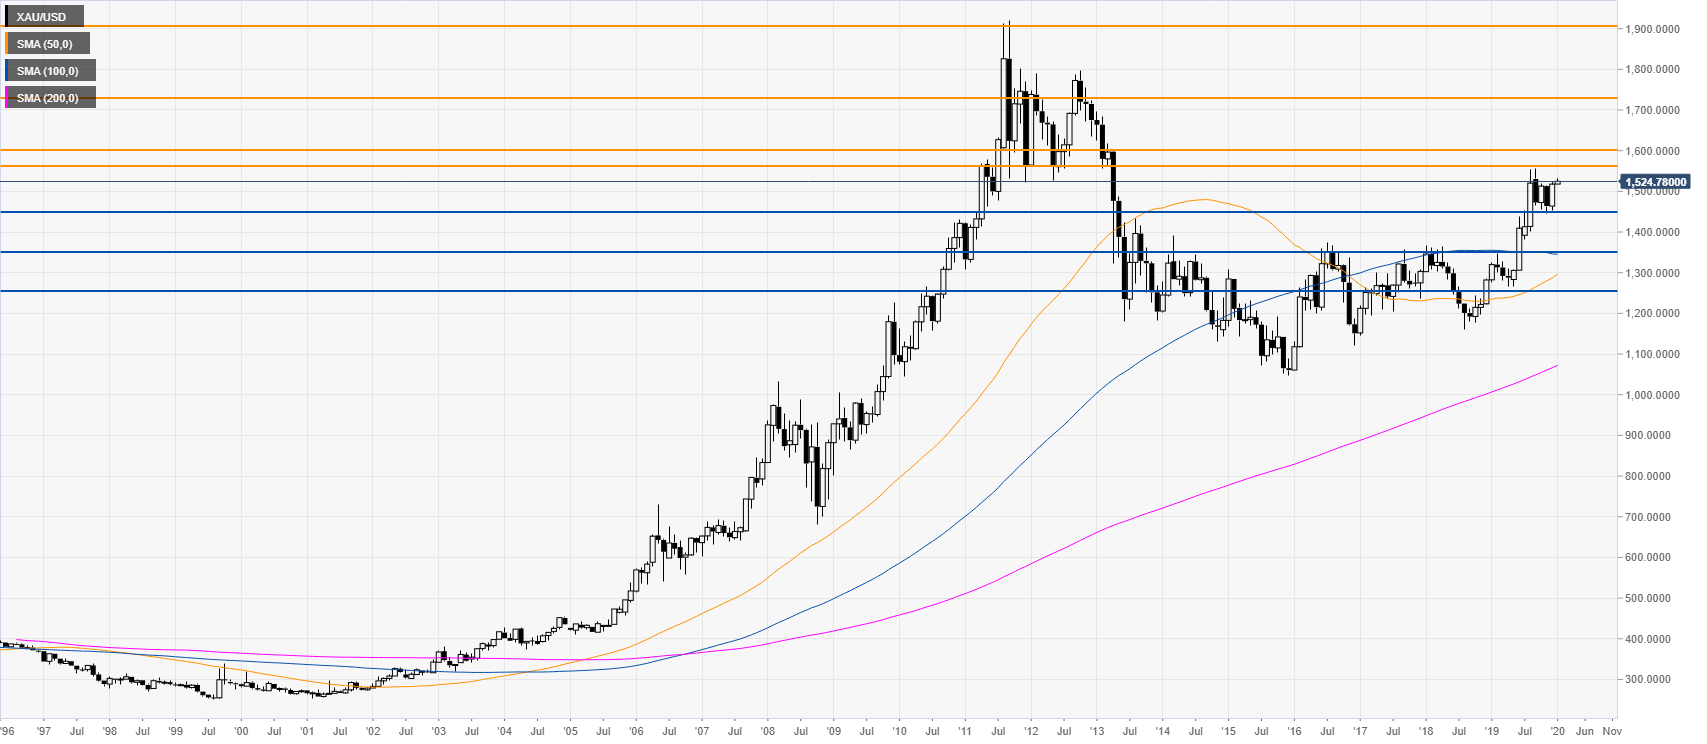
- XAU/USD saw a bullish run in 2019 and it is now starting 2020 at its highest since April 2013.
- The level to beat for bulls is the 1560/1600 price zone.
Gold monthly chart
Gold is trading in an uptrend above the main monthly simple moving averages (SMAs). In the last four months, the market has been trading sideways in a bull flag. If the buyers manage a convincing breakout above the 1560/1600 price zone, the market could rise towards the 1730 and 1900 resistance levels. On the flip side, if sellers break 1445 support, the yellow metal could correct down and test the 1350 and 1250 levels.

Additional key levels
