Back


30 Dec 2019
USD/INR Price Analysis: Greenback recovery against the rupee is doubtful
- USD/INR formed a bear flag in the second part of December.
- The level to beat for bears is the 71.20 support.
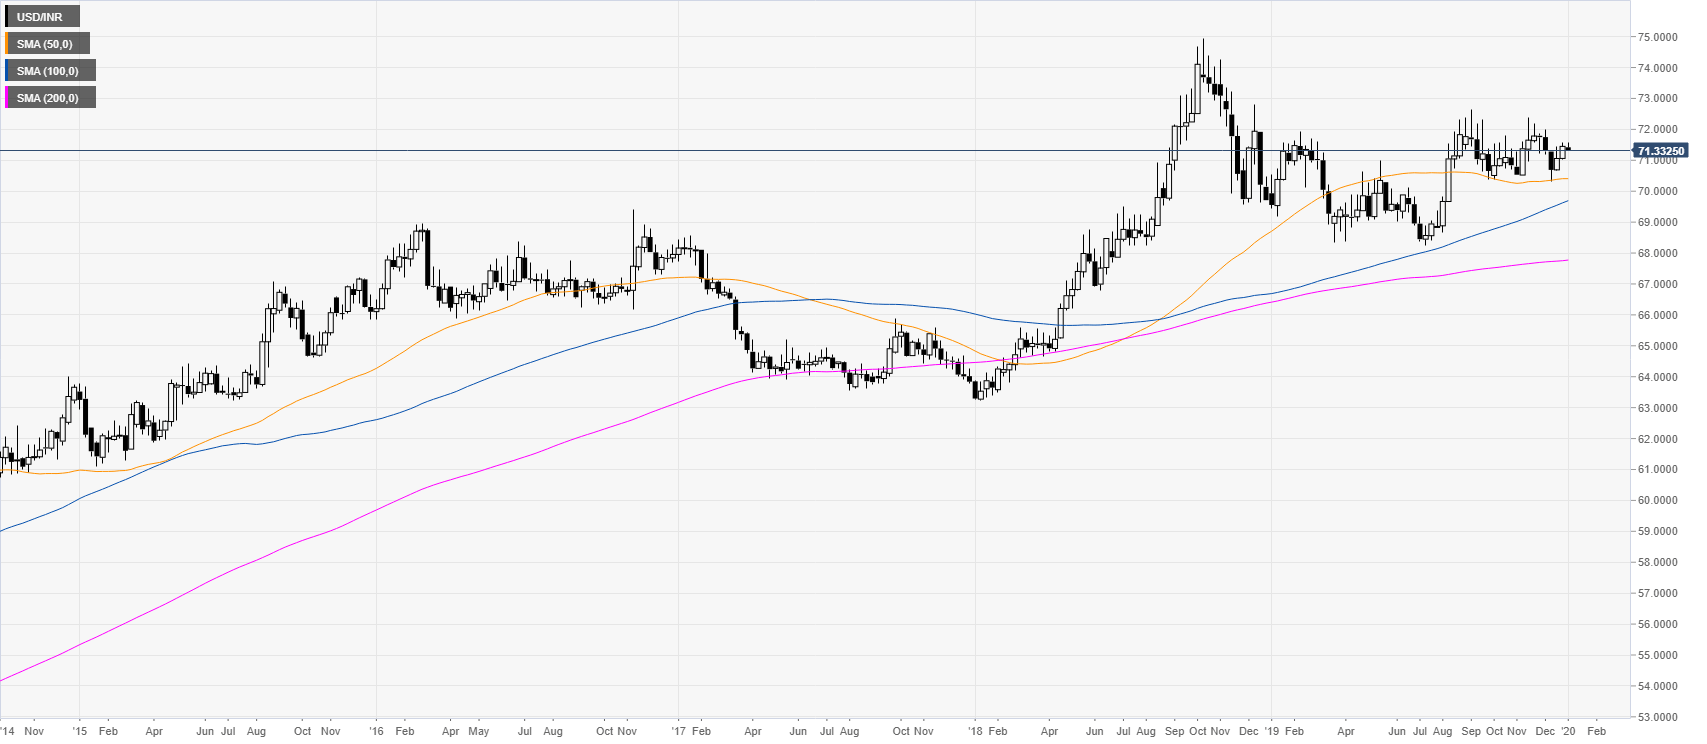
USD/INR weekly chart
This year the market has been consolidating the 2018 bullish advance while holding above the 100/200-period weekly simple moving averages.

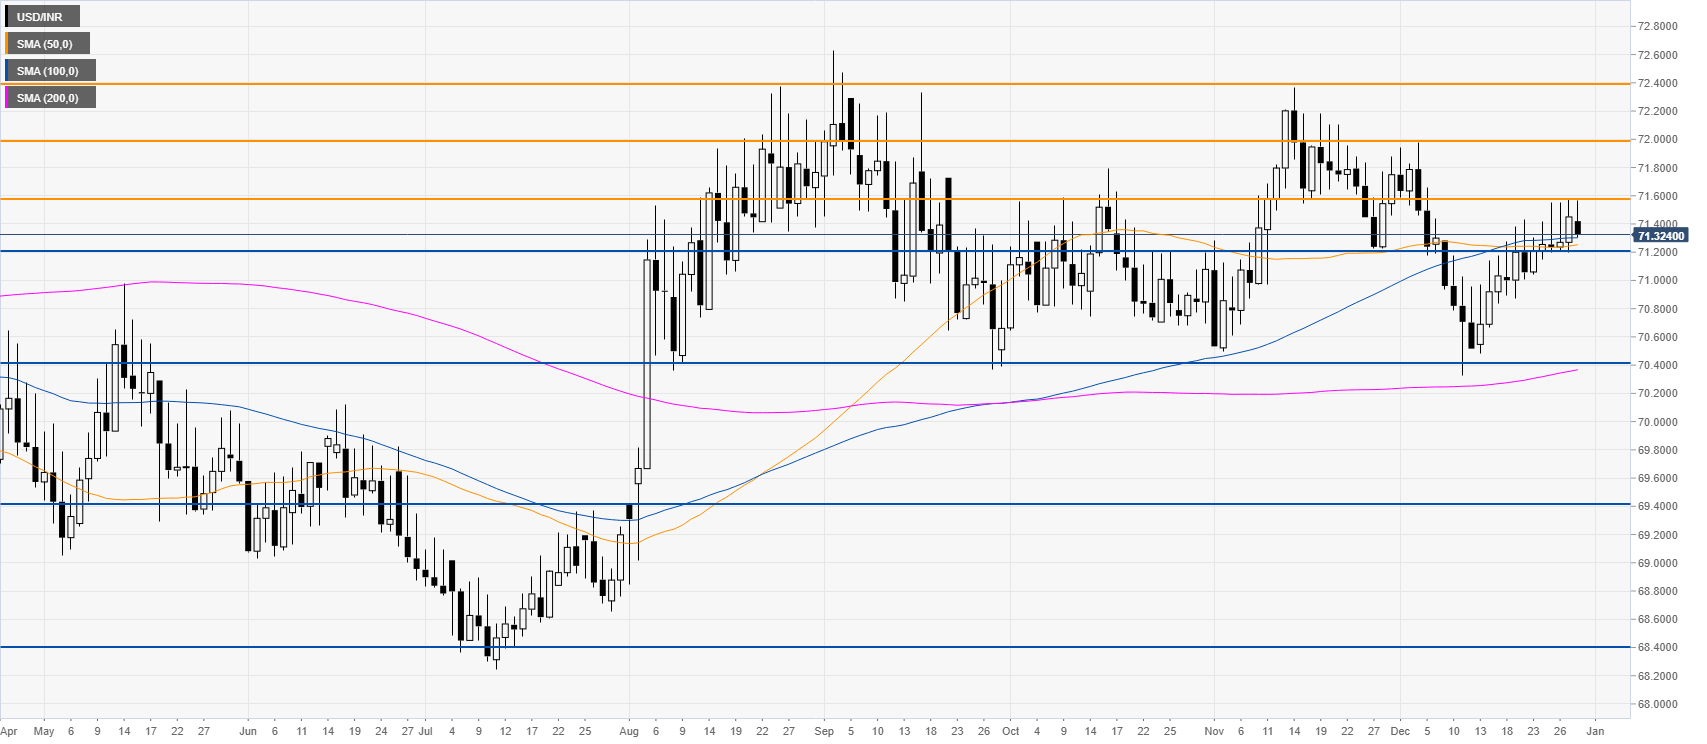
USD/INR daily chart
In the second half of December, the market created a bear flag below the 71.60 resistance. A break below the 71.20 support level could open the doors to a drop towards the 70.40 strong support level. If the bears overcome 70.40, the market has room to fall to the 69.40 and 68.40 levels. Resistances are seen at 71.60, 72.00 and 72.40 levels.

Additional key levels
