Back
5 Dec 2019
EUR/USD price analysis: Euro rolling into Asia pressuring the 1.1103 resistance
- EUR/USD has been grinding up slowly throughout the entire Thursday trading session.
- The level to beat for bulls is the 1.1103 resistance.
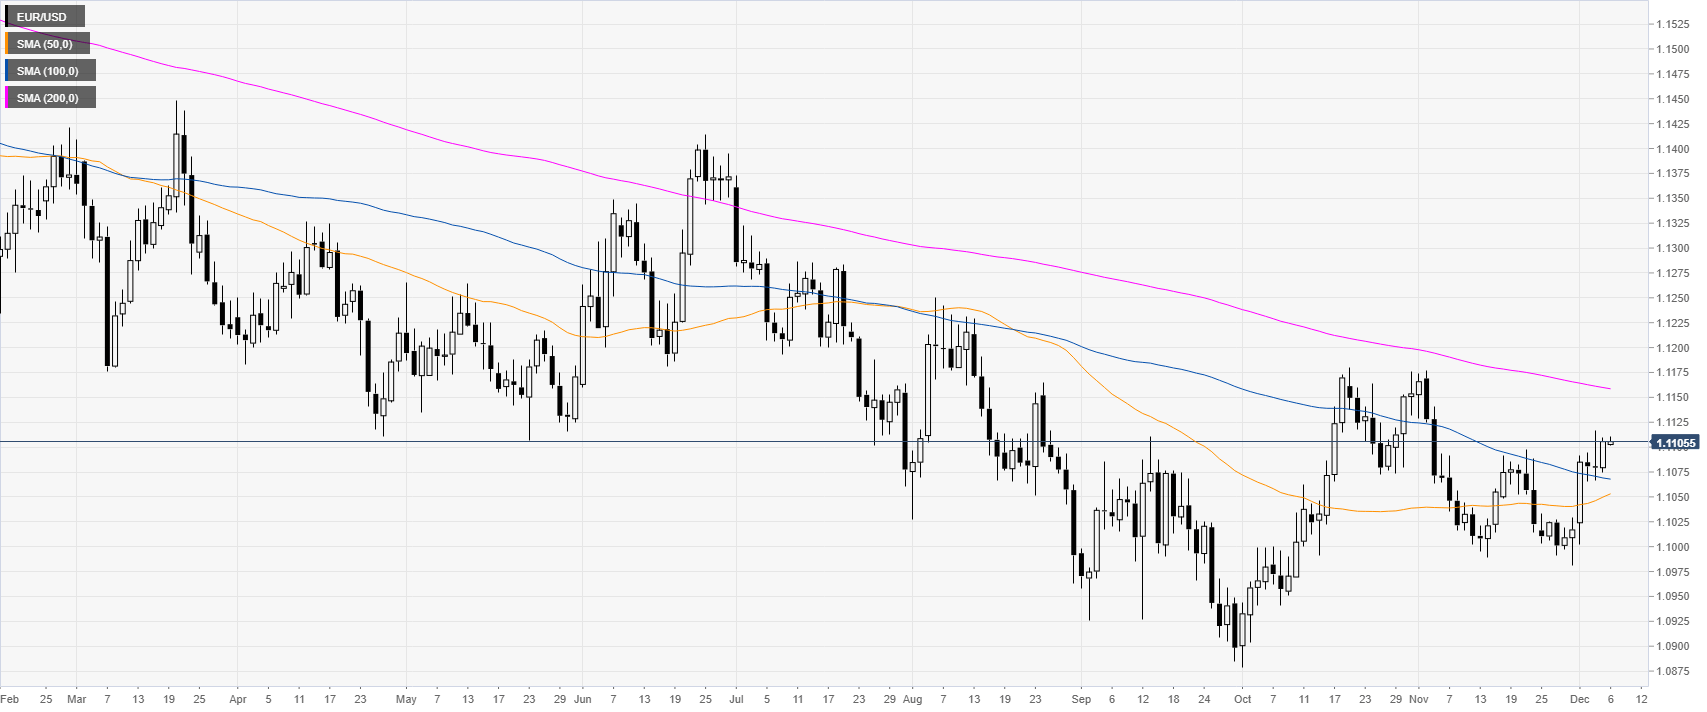
EUR/USD daily chart
EUR/USD, on the daily chart, is trading in a downtrend below the 200-day simple moving average (DMA). However, since the start of December, the market is spiking up to the 1.1103 resistance.
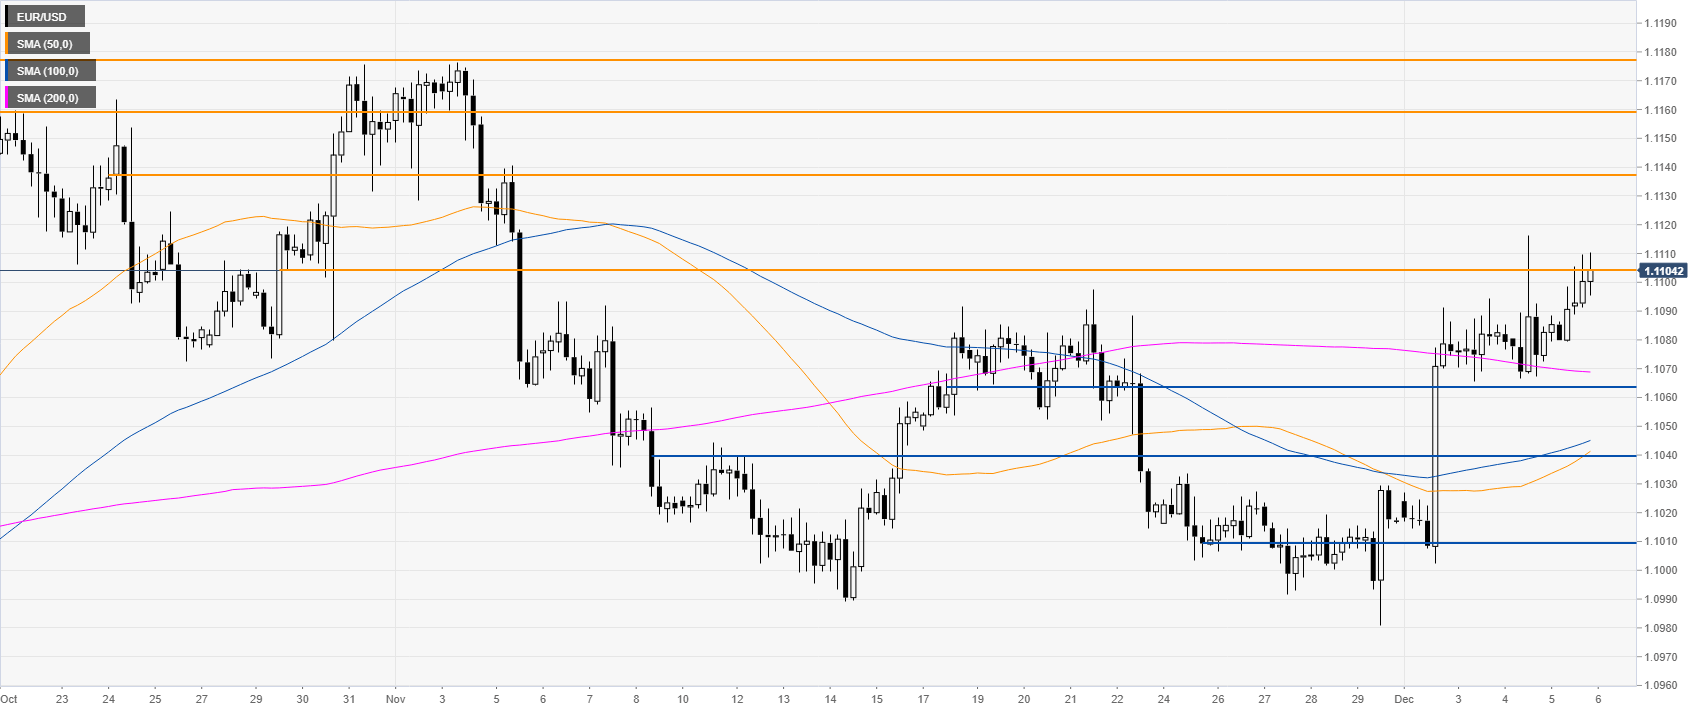
EUR/USD four-hour chart
EUR/USD is painfully challenging the 1.1103 resistance. Even though the spot is moving in slow motion, the buyers are in charge for the time being. A break of 1.1103 could lead to the 1.1138 level, where some resistance can be expected. Further up lie the 1.1161/78 resistance zone, according to the Technical Confluences Indicator.
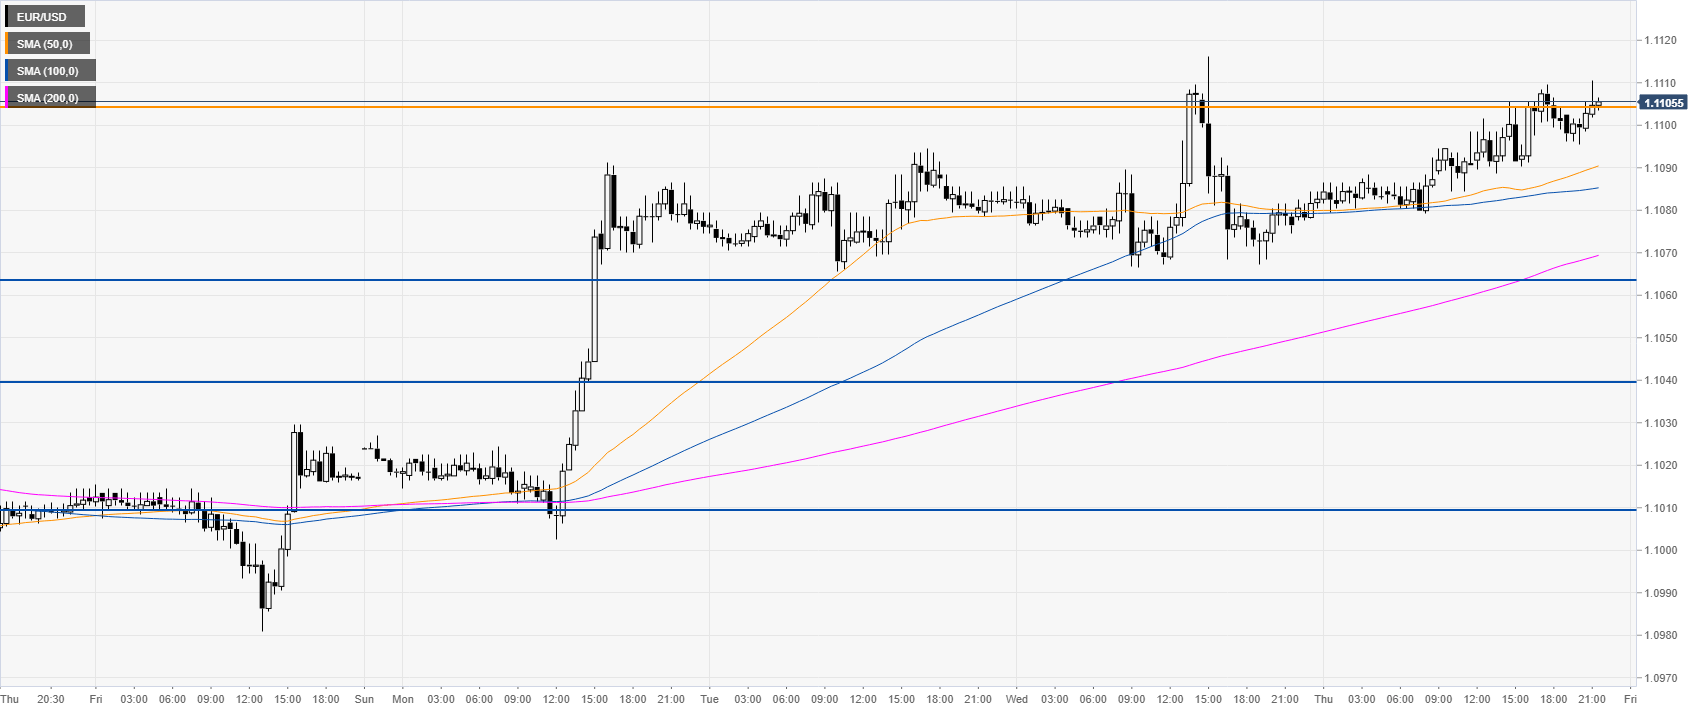
EUR/USD 30-minute chart
The euro continues to grind up while trading above the main SMAs. Support can be seen at the 1.1063, 1.1040 and 1.1011 price levels, according to the Technical Confluences Indicator.
Additional key levels