AUD/JPY technical analysis: Straightforward bullish case so long as respecting the bull-channel support
- The week ahead will determine the near term fate of the market's risk barometer.
- AUD/JPY is on the cusp of a major rebound from key technical support.
- Bulls will hunt down a 50% man reversion of fall fate to an attack towards the 73 handle.
AUD/JPY Daily Chart
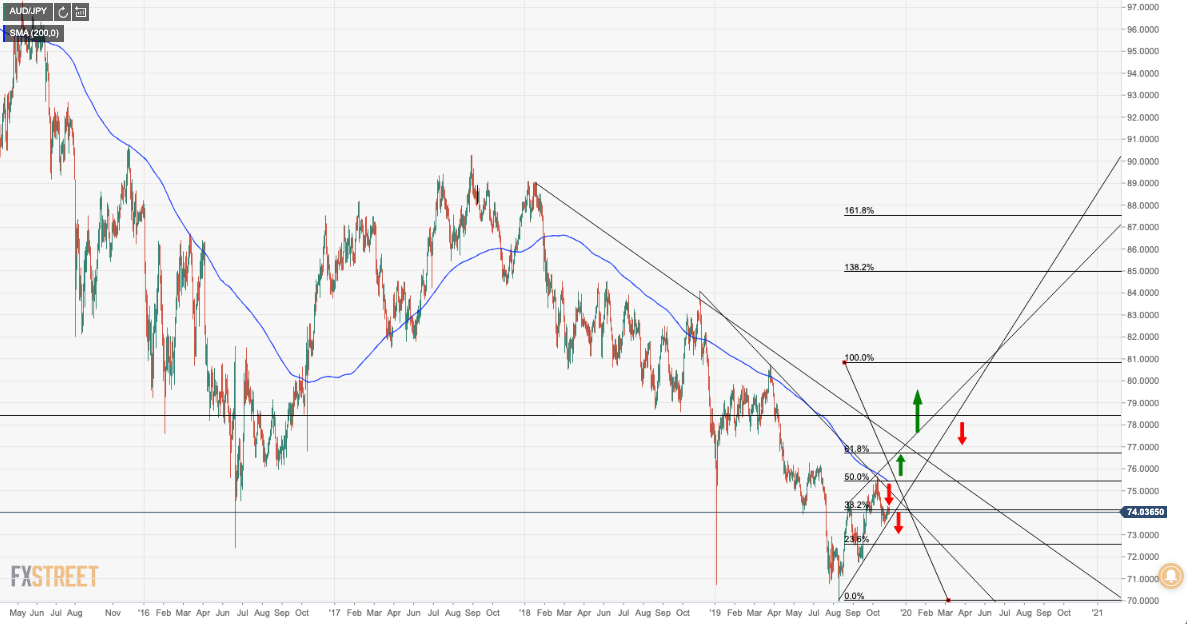
As the daily chart depicts, a bullish constrictive play is on the cards to trend-line resistance. With bulls respecting the 38.2% Fibonacci retracement of the painted Summer highs to YTD lows, a break of a 50% reversion of the said range opens the gateway towards a 61.8% Fibo target – noting that the said resistance has a critical confluence of the 200-day moving average.
AUD/JPY 4-hour chart
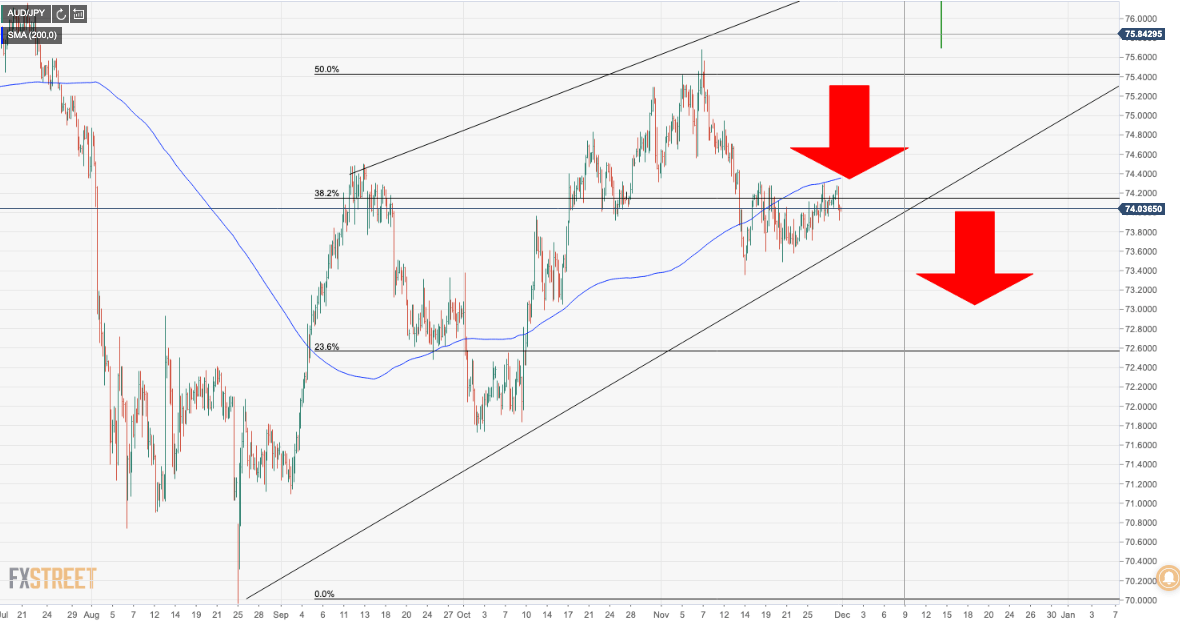
The four-hour time frame highlights a bearish risk where the price is failing to convince at the 200-moving average – thus exposing 74 the figure as a key psychosocial level.
Mixing up a little of the fundamentals complicates a technically bullish case
While technicals would favour a bullish bias, if respecting the channel's make-up, its a key week for the Aussie and fundamentals cannot be ignored, from a focus on the RBA this week, as well as economic data. We have a major highlight as being the Q3 Gross Domestic Product while traders should note that Australia’s economy only grew at 1.4% over the year to June, which was the slowest pace since 2009 – bearish AUD.
Meanwhile, a deeper technical analysis will draw us in on the more immediate picture. We have witnessed a series of bearish sessions when examining the hourly chart:
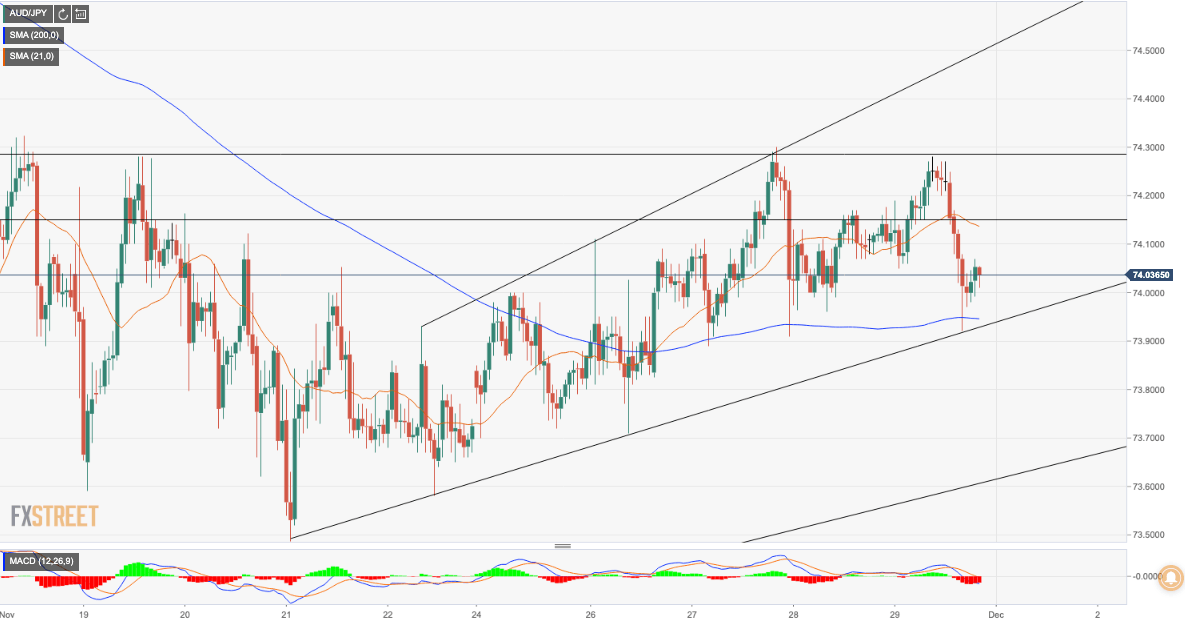
However, the price has respected the 21-hour moving average on multiple occasions giving rise to a near term bullish bias towards a 74.30 resistance target and tripple-top scenario within the latest ascending channel.