Back
3 Sep 2019
GBP/USD technical analysis: Cable reversing intraday losses as UK’s PM Boris Johnson loses majority
- GBP/USD is bouncing from multi-year lows as the UK’s Prime Minister Boris Johnson loses the majority.
- Bulls would ideally need a daily close above 1.2132 to have a credible recovery.
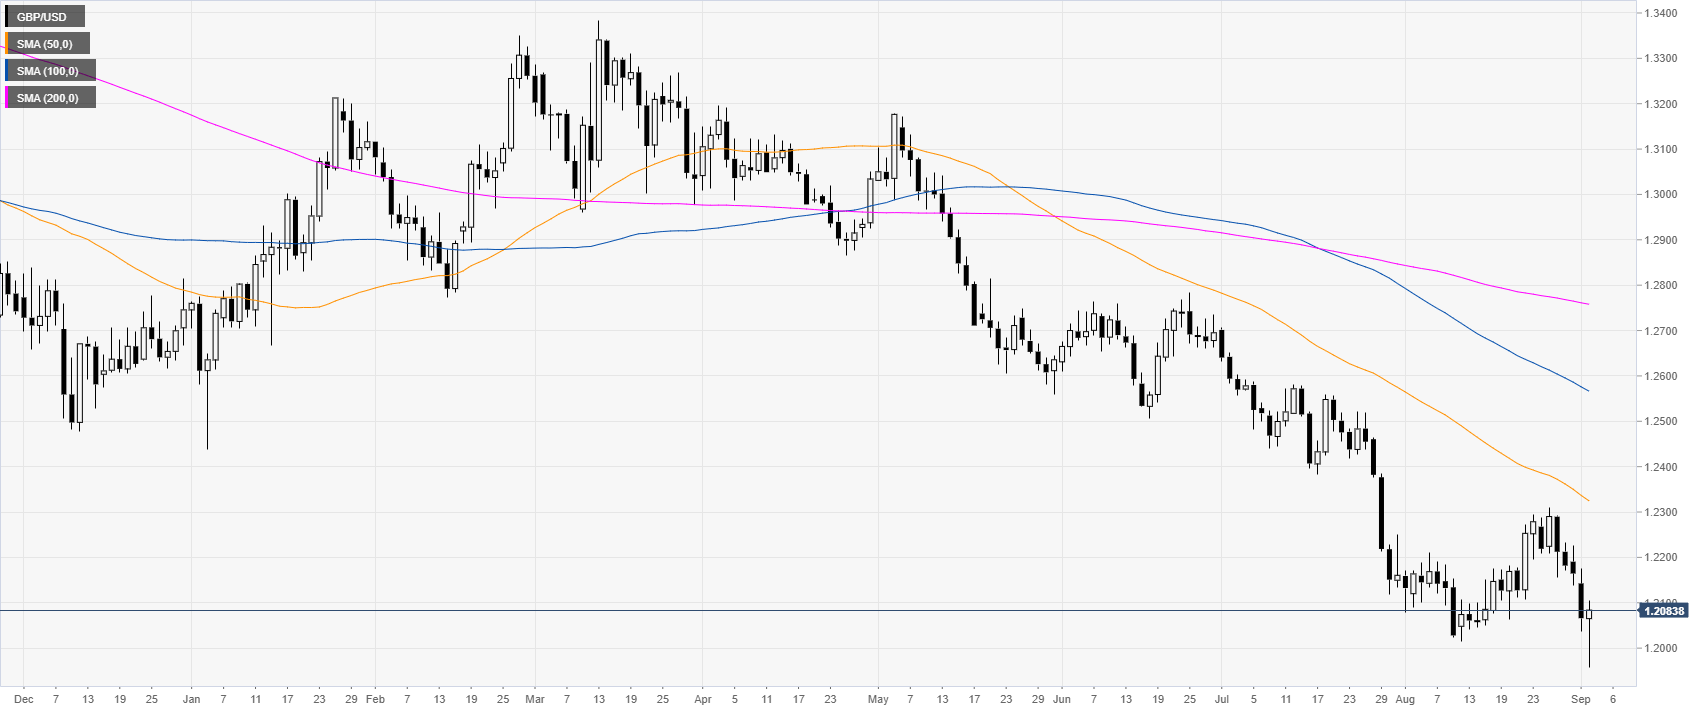
GBP/USD daily chart
The Sterling is trading in a bear trend below its main daily simple moving averages (SMAs). The market is rebounding sharply from multi-year lows as conservative Phillip Lee defects and UK PM Boris Johnson loses the majority.
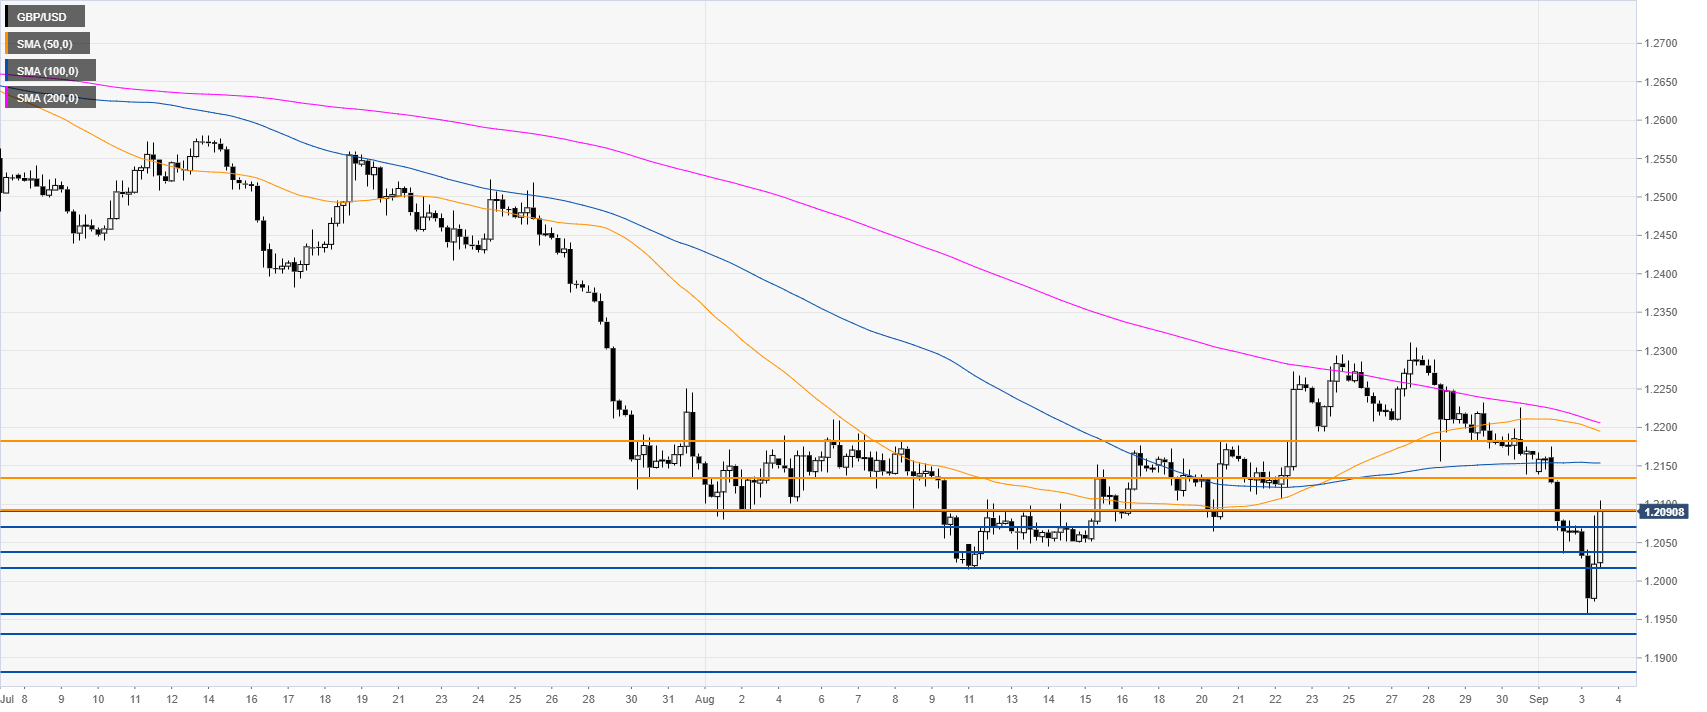
GBP/USD 4-hour chart
GBP/USD is recovering as it is challenging the 1.2095 resistance. Immediate resistances can be seen near 1.2132 and the 1.2182 level, according to the Technical Confluences Indicator.
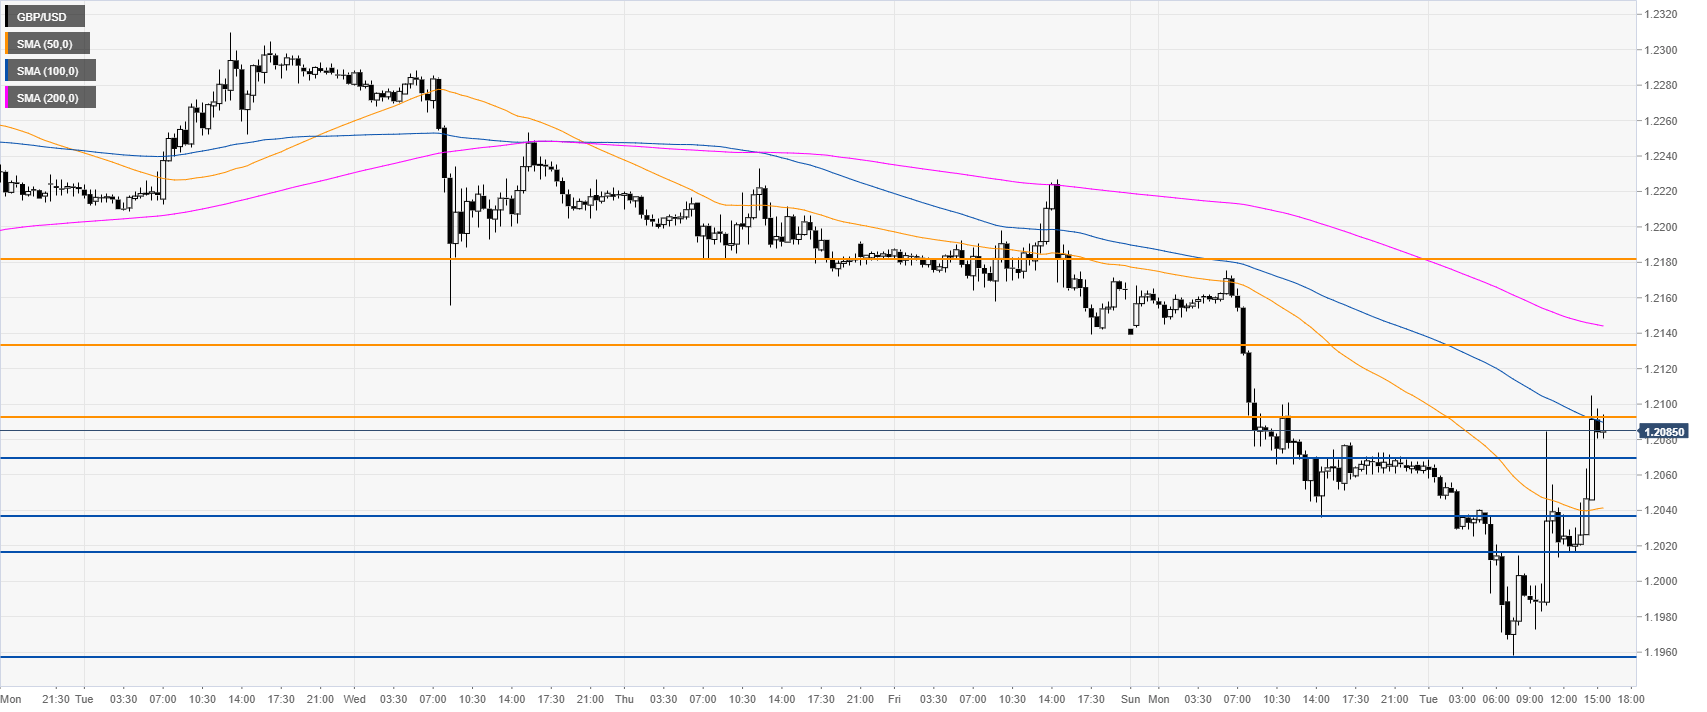
GBP/USD 30-minute chart
GBP/USD is pressuring the daily highs near the 1.2095 resistance and the 100 SMA, suggesting a consolidation up in the near term. Immediate support can be seen at the 1.2070, 1.2038, and 1.2018, according to the Technical Confluences Indicator.
Additional key levels