Back
11 Jul 2019
GBP/USD technical analysis: Cable erasing its intraday gains, sub-1.2535 resistance
- GBP/USD is erasing its intraday gains as the market trades below 1.1235.
- On the way down supports can be seen at the 1.2510 and 1.2477 levels.
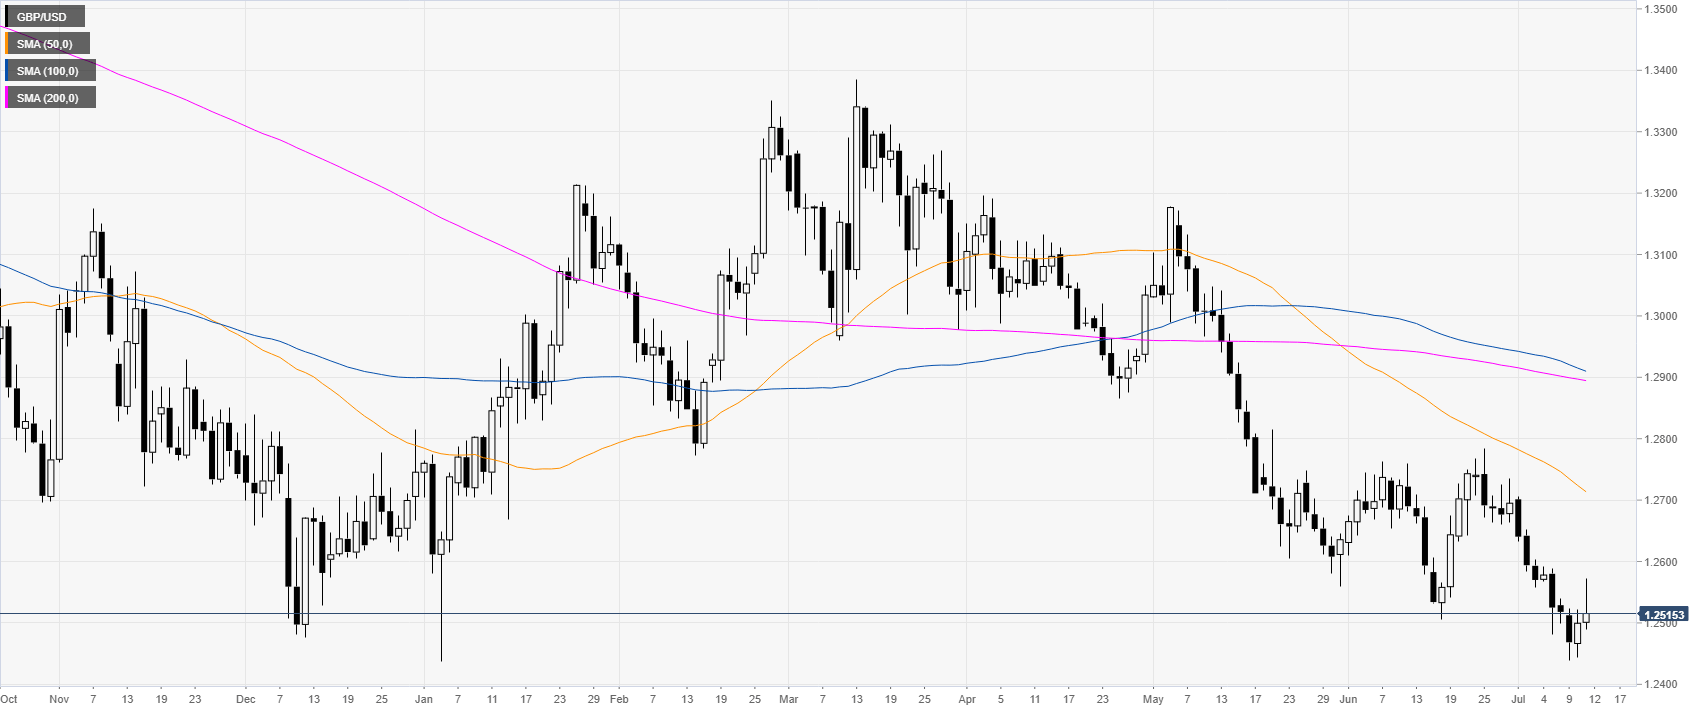
GBP/USD daily chart
GBP/USD is trading in a bear trend below its main daily simple moving averages (DSMAs). The market is progressively erasing its intraday gains made on Thursday.
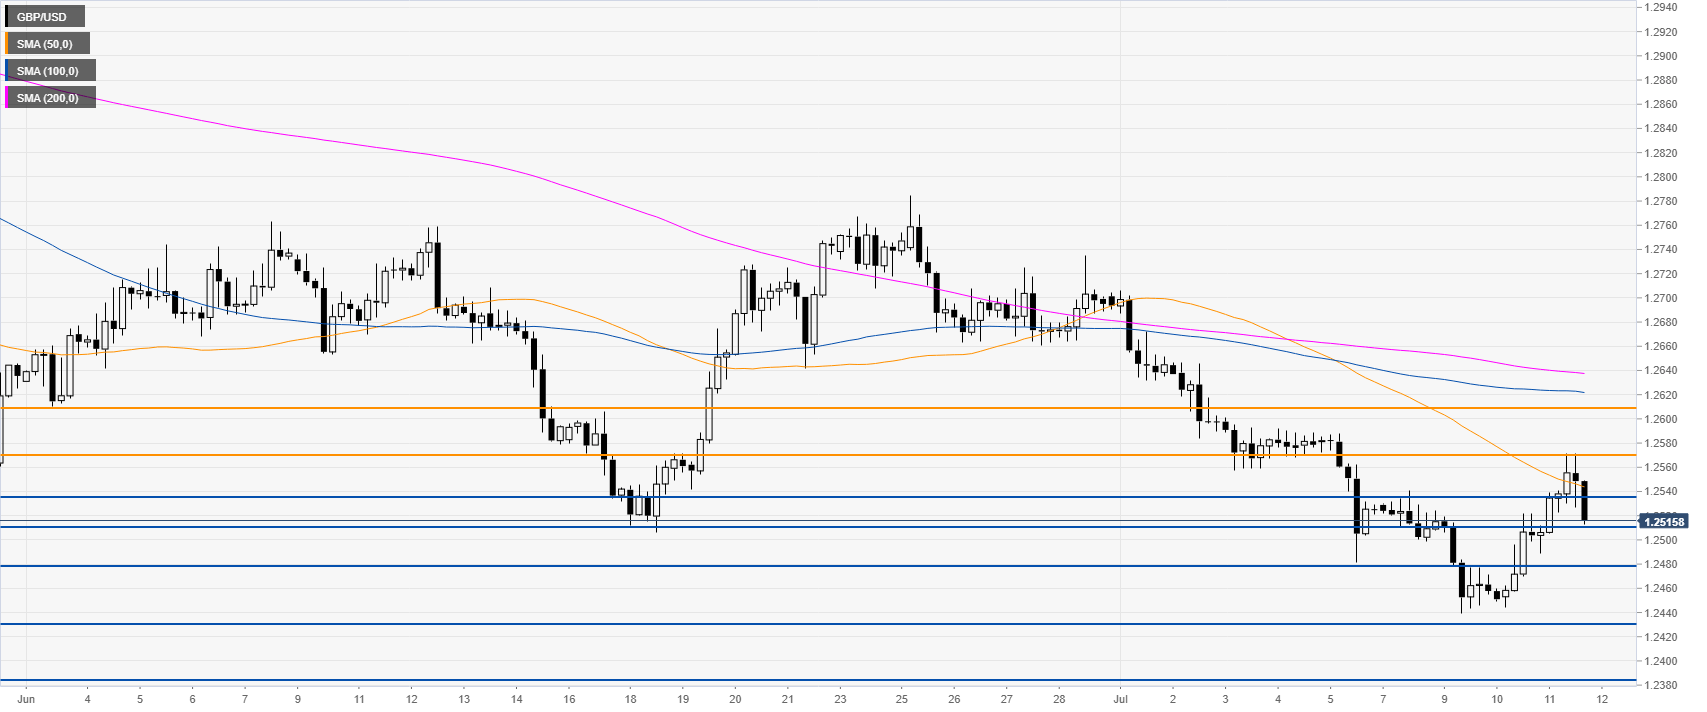
GBP/USD 4-hour chart
GBP/USD is found resistance at 1.2570 and the 50 SMA. The market is under bearish pressure as it is close to test the 1.2510 support. The next support is seen at 1.2477 according to the Technical Confluences Indicator.
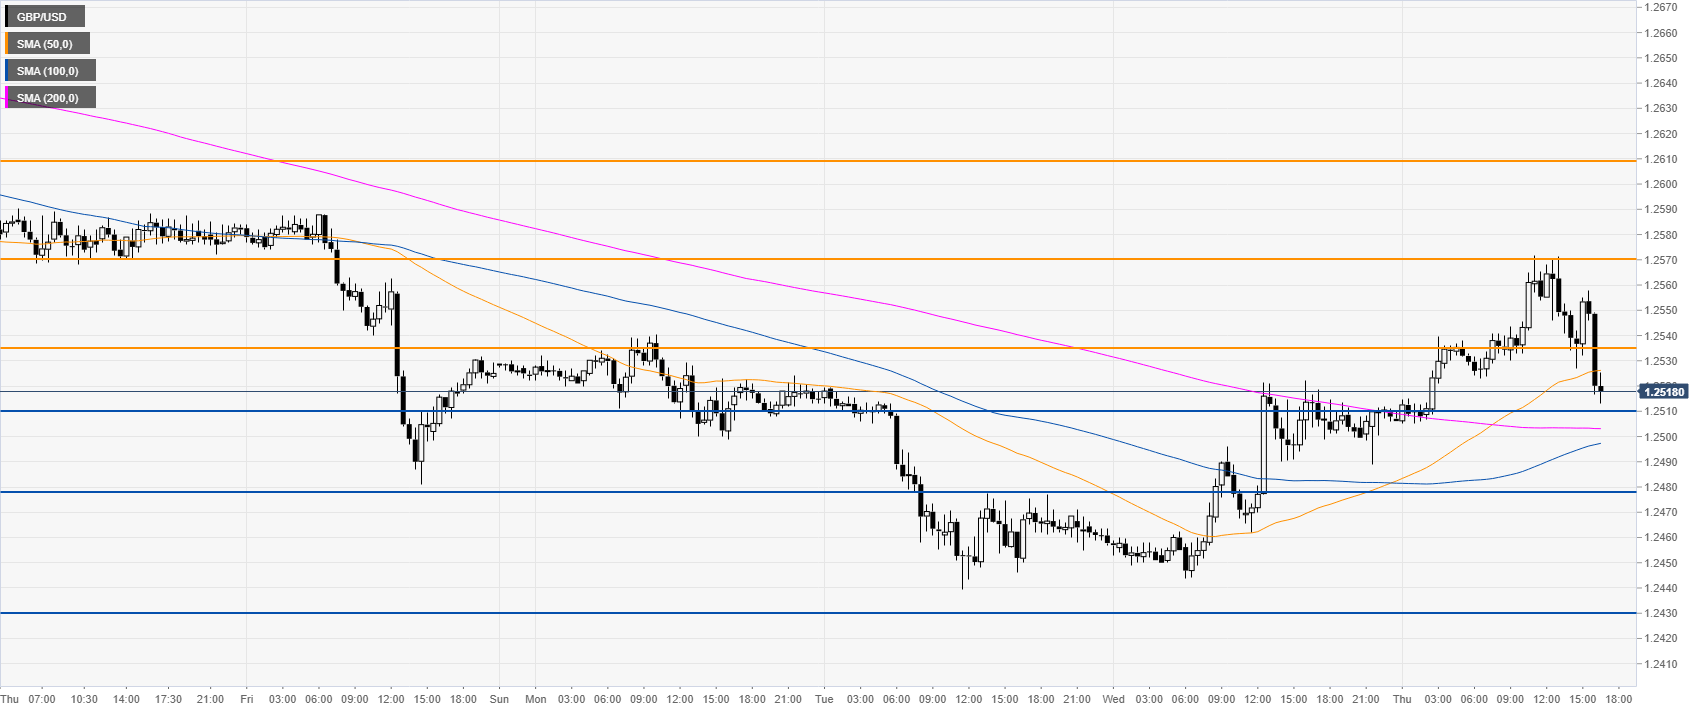
GBP/USD 30-minute chart
GBP/USD is trading below its 50 SMA suggesting a correction down in the near term. Resistances can be seen near the 1.2535 and 1.2570 levels, according to the Technical Confluences Indicator.
Additional key levels