Back
13 May 2019
GBP/USD technical analysis: Head and shoulder pattern is driving the Cable sharply below 1.3000 figure
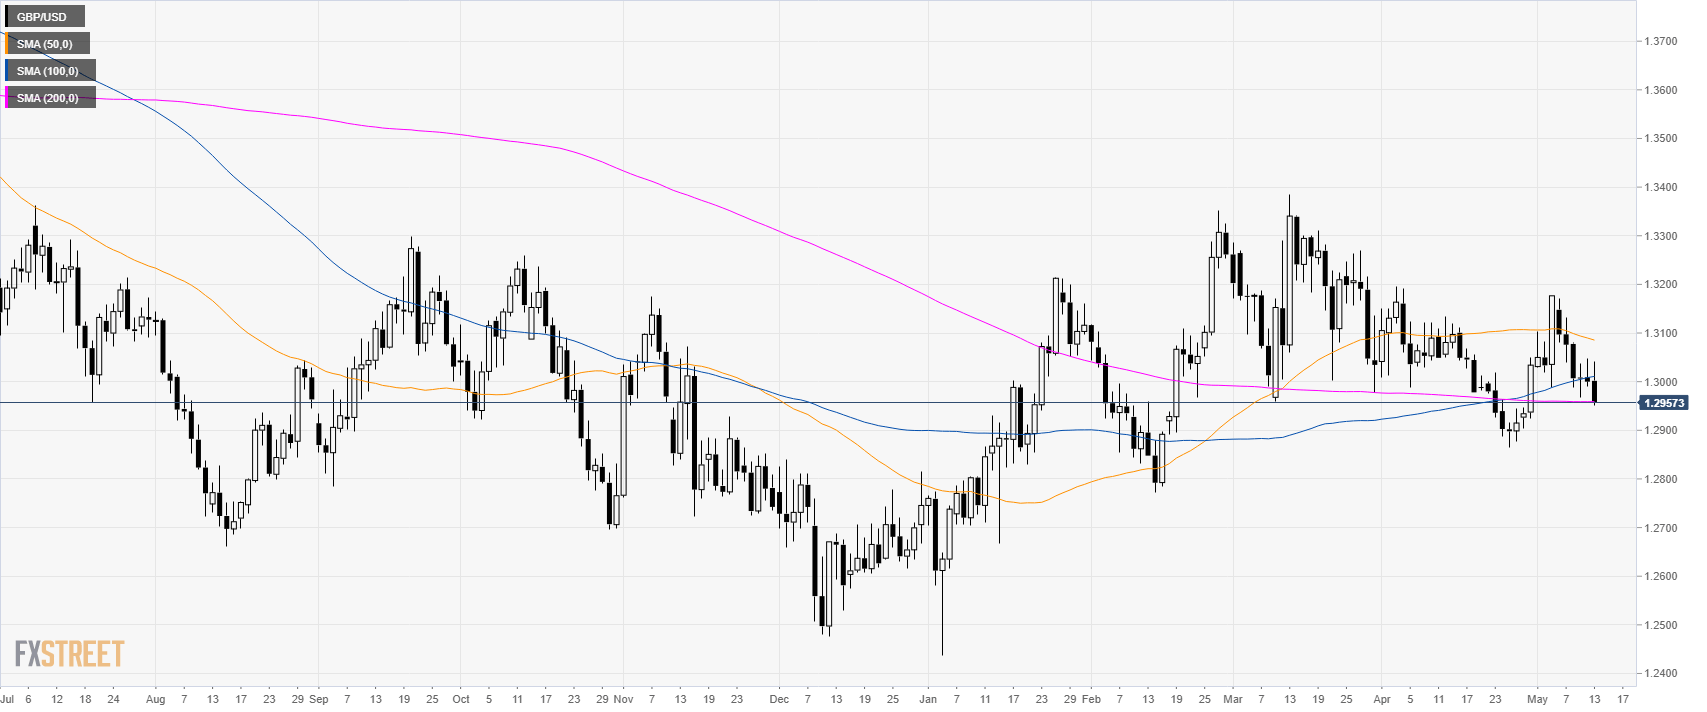
GBP/USD daily chart
GBP/USD is trading down sharply as bears break the 1.3000 figure.
GBP/USD is trading just near its 200 SMA at 1.2958 level.

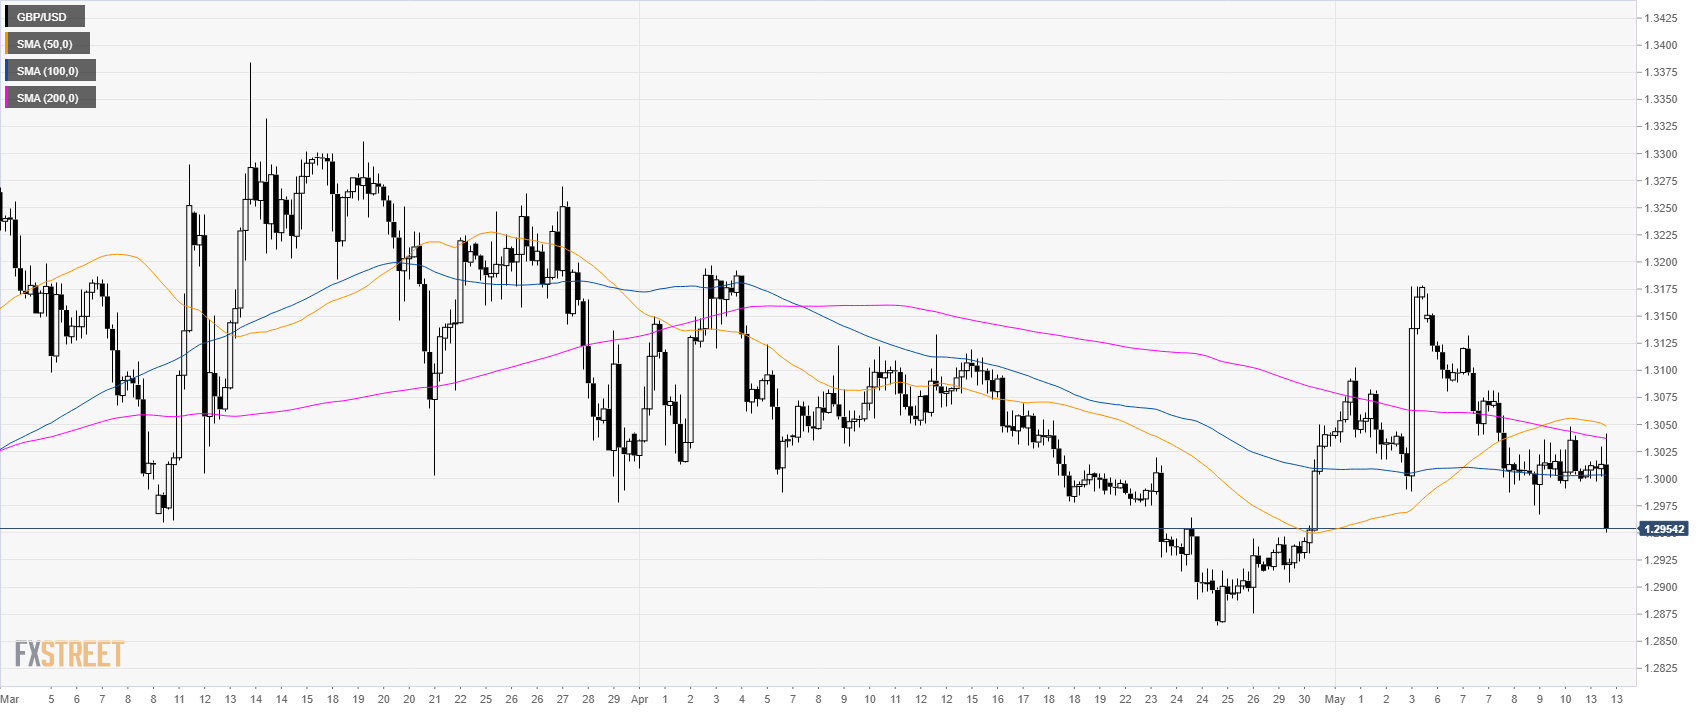
GBP/USD 4-hour chart
Cable formed a head and shoulder pattern sending the currency pair below the 1.3000 figure.

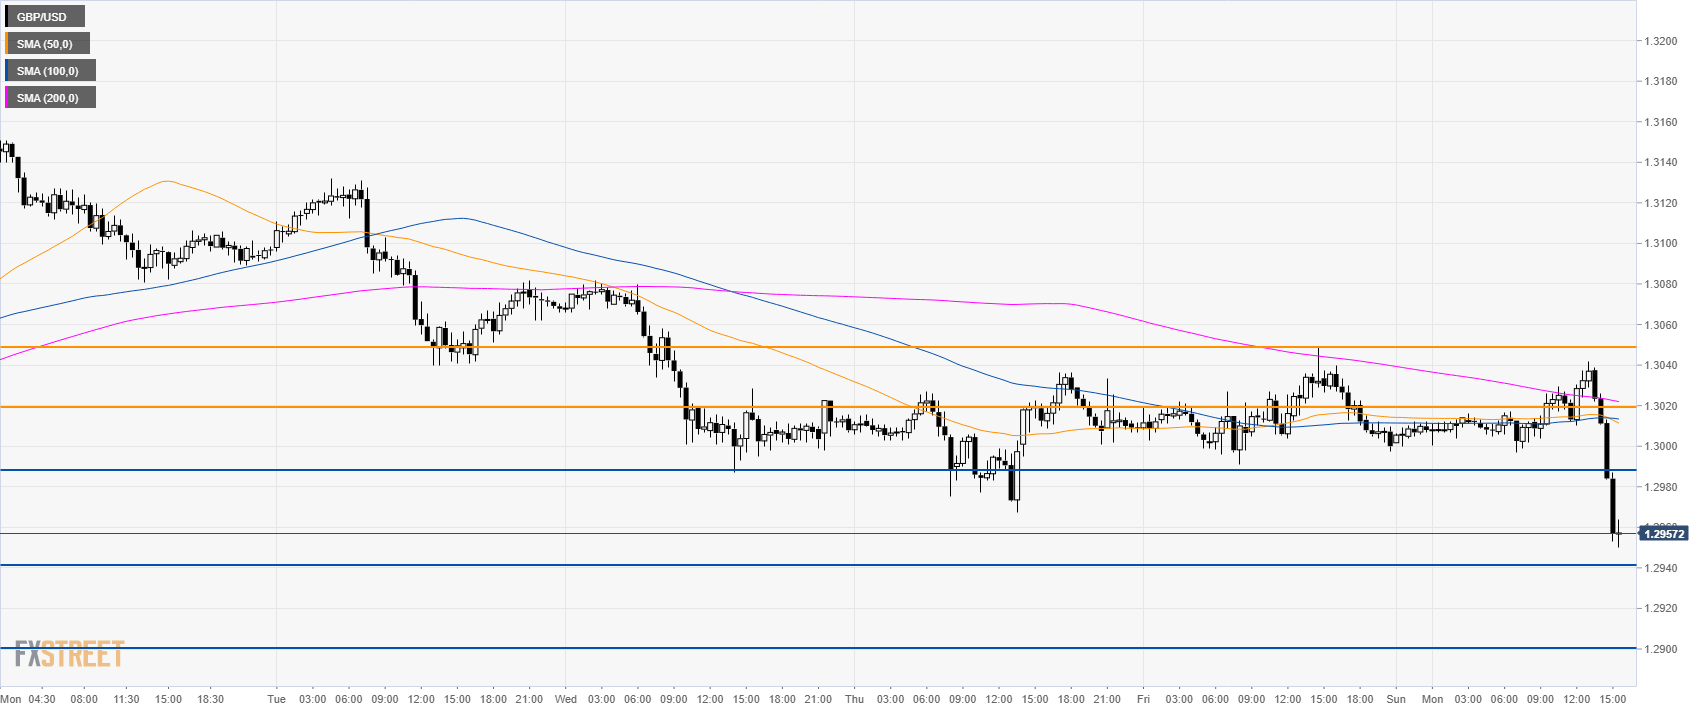
GBP/USD 30-minute chart
The picture worsened considerably as the market is approaching 1.2940 support. A breach below that level can see the 1.2900 figure on the cards for bears.
Resistance is seen at 1.2990 and 1.3020/50 levels.

Additional key levels
