Back
21 Mar 2019
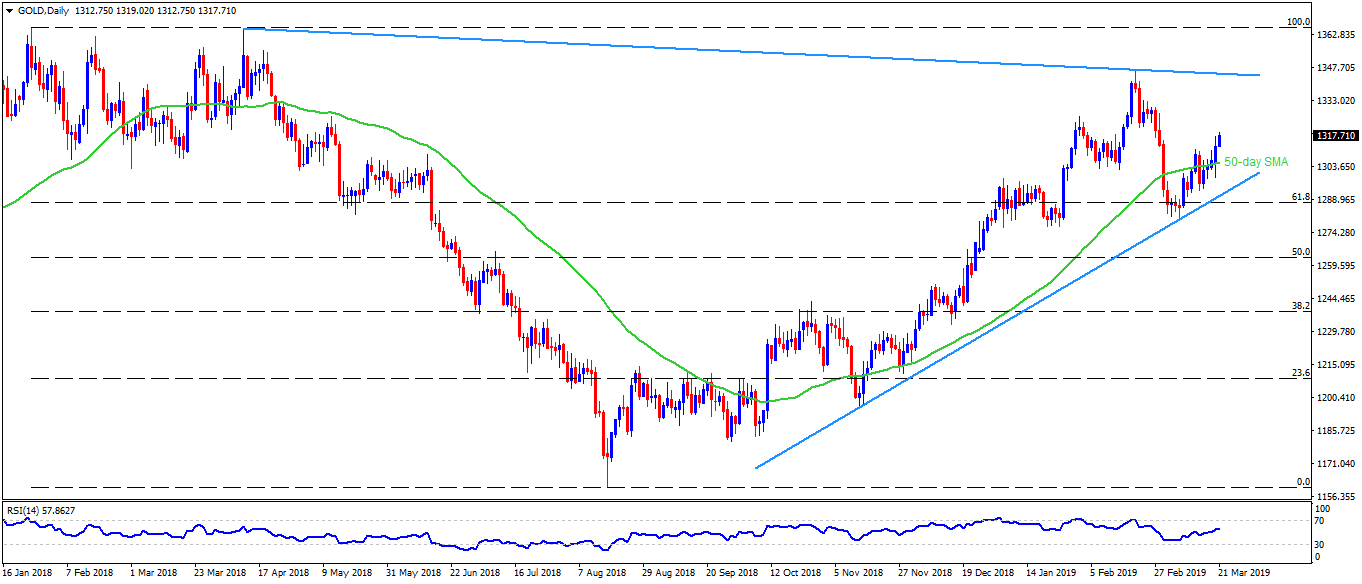
Gold Technical Analysis: $1321 becomes bulls’ favorite as they welcome 3-week high
Gold daily chart
- Gold is taking the bids around a 3-week high of $1319 during early Thursday.
- Having successfully breached 50-day simple moving average (SMA) figure of $1305.60, the yellow metal also crossed $1317 intermediate halt and is now progressing towards February 21 low of $1321.
- Should prices rally beyond $1321, there are multiple resistances around $1330 and $1337 whereas a descending trend-line stretched since April 2018 can challenge bulls at $1345.
- Meanwhile, the bullion’s slip under $1305.60 can recall $1300 on the chart whereas an upward sloping support-line that joins November – March lows, at $1290, could gain market attention afterward.
- Additionally, the quote’s downturn under $1290 might require validation of the 61.8% Fibonacci retracement level of January to August 2018 south-run, at $1287, in order to aim for $1280 and $1276.
Gold 4-Hour chart
- An ascending trend-channel describing current month moves also signify $1321 resistance as its upper-line whereas $1333 can act as a halt between $1330 and $1337.
- On the downside, $1302 and $1289 are additional supports to watch during the pullback.

Gold hourly chart
- Be it 61.8% Fibonacci retracement of February – March declines, descending trend-line joining late-Feb highs or a rising line joining highs since March 04, all of them emphasize $1321 as important resistance.
- $1328 acts as another upside barrier whereas $1312 could become extra support.
