Gold Technical Analysis: Yellow Metal falling at its lowest in four days
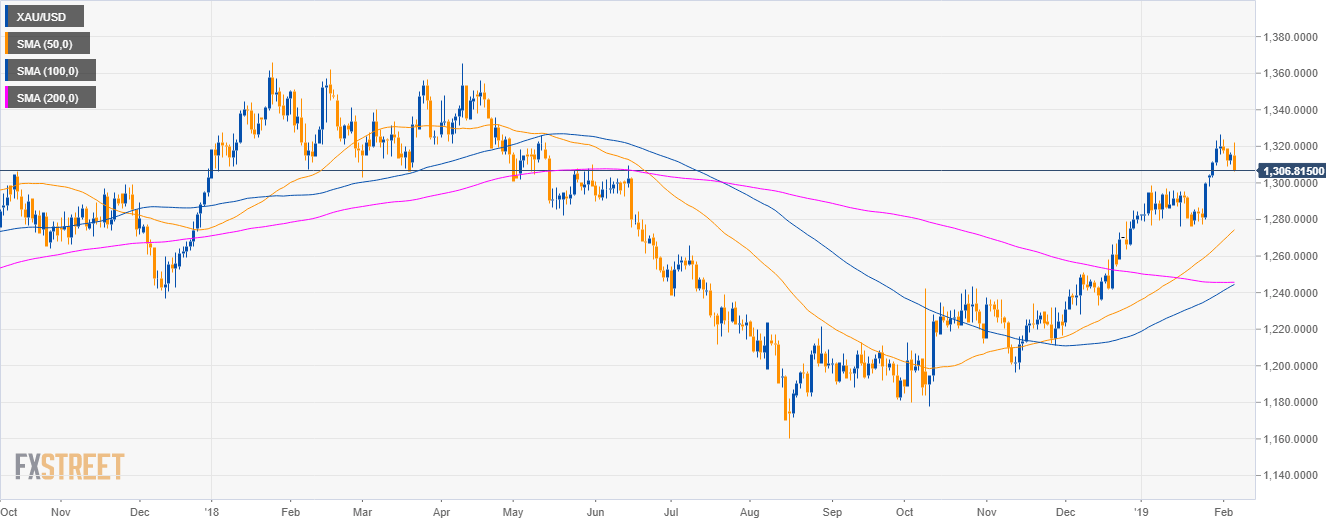
Gold daily chart
- Gold is in a bull trend above its main simple moving averages (SMAs).
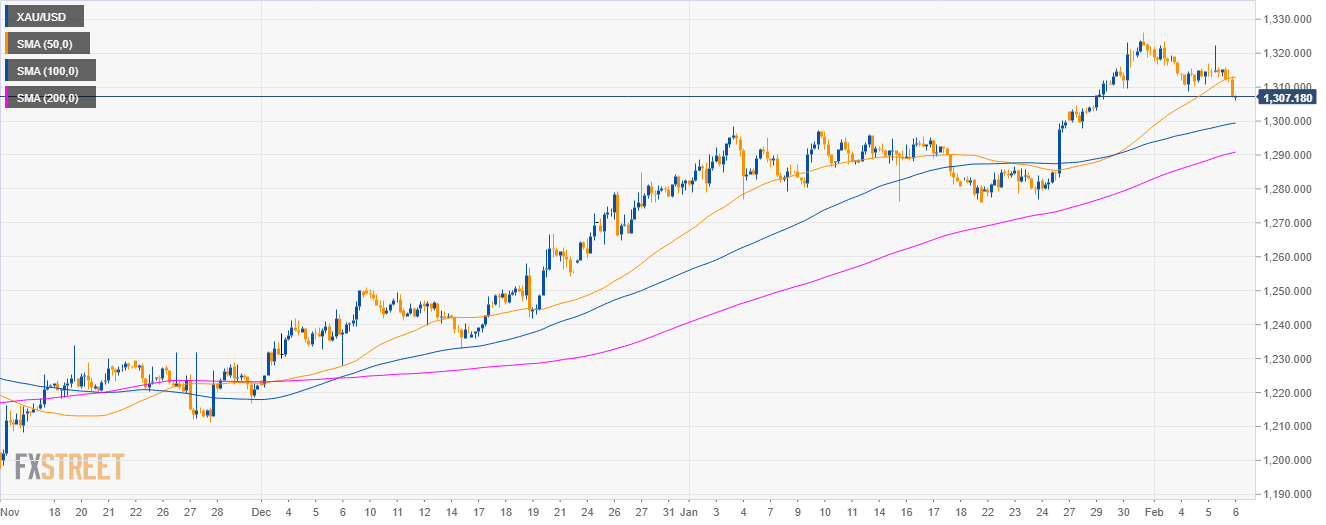
Gold 4-hour chart
- Gold broke below the 50 SMA.
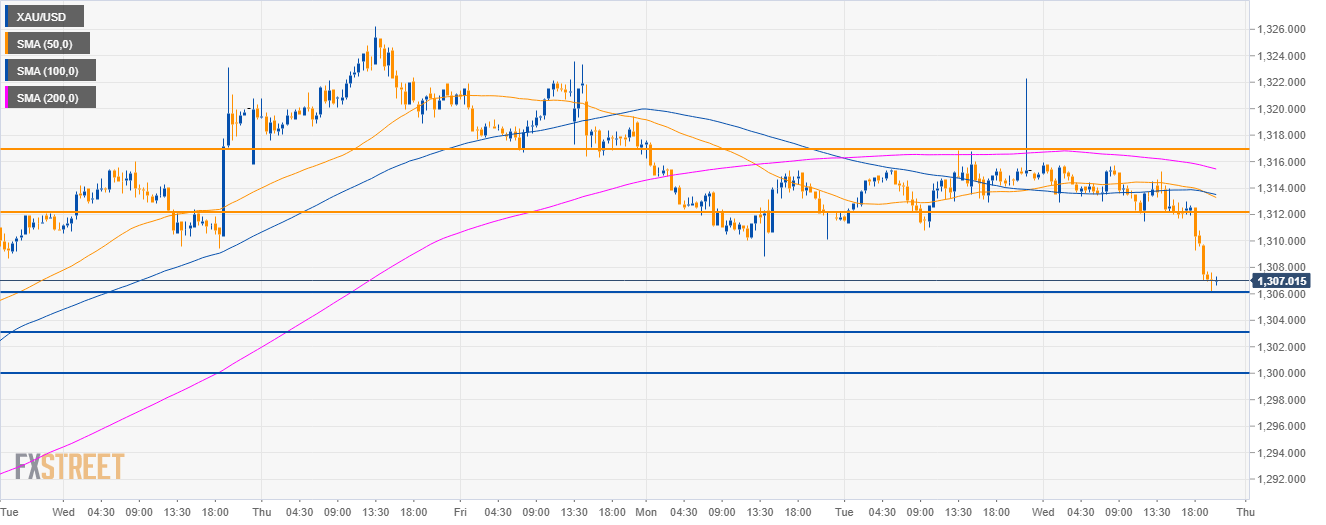
Gold 30-minute chart
- Gold is trading below its main SMAs suggesting a bearish bias.
- The level to beat for bear is 1,306.00 followed by 1,303.00 and 1,300.00 the figure.
- To the upside, resistance can be seen near 1,312.00 and 1,317.00 level.
Additional key levels
XAU/USD
Overview:
Today Last Price: 1306.99
Today Daily change: -8.27 points
Today Daily change %: -0.63%
Today Daily Open: 1315.26
Trends:
Daily SMA20: 1296.91
Daily SMA50: 1272.58
Daily SMA100: 1245.75
Daily SMA200: 1230.24
Levels:
Previous Daily High: 1316.85
Previous Daily Low: 1310.1
Previous Weekly High: 1326.25
Previous Weekly Low: 1297.8
Previous Monthly High: 1326.25
Previous Monthly Low: 1275.9
Daily Fibonacci 38.2%: 1314.27
Daily Fibonacci 61.8%: 1312.68
Daily Pivot Point S1: 1311.29
Daily Pivot Point S2: 1307.32
Daily Pivot Point S3: 1304.54
Daily Pivot Point R1: 1318.04
Daily Pivot Point R2: 1320.82
Daily Pivot Point R3: 1324.79