Back
16 Nov 2018
GBP/JPY Technical Analysis: Twisting under Brexit headline pressure
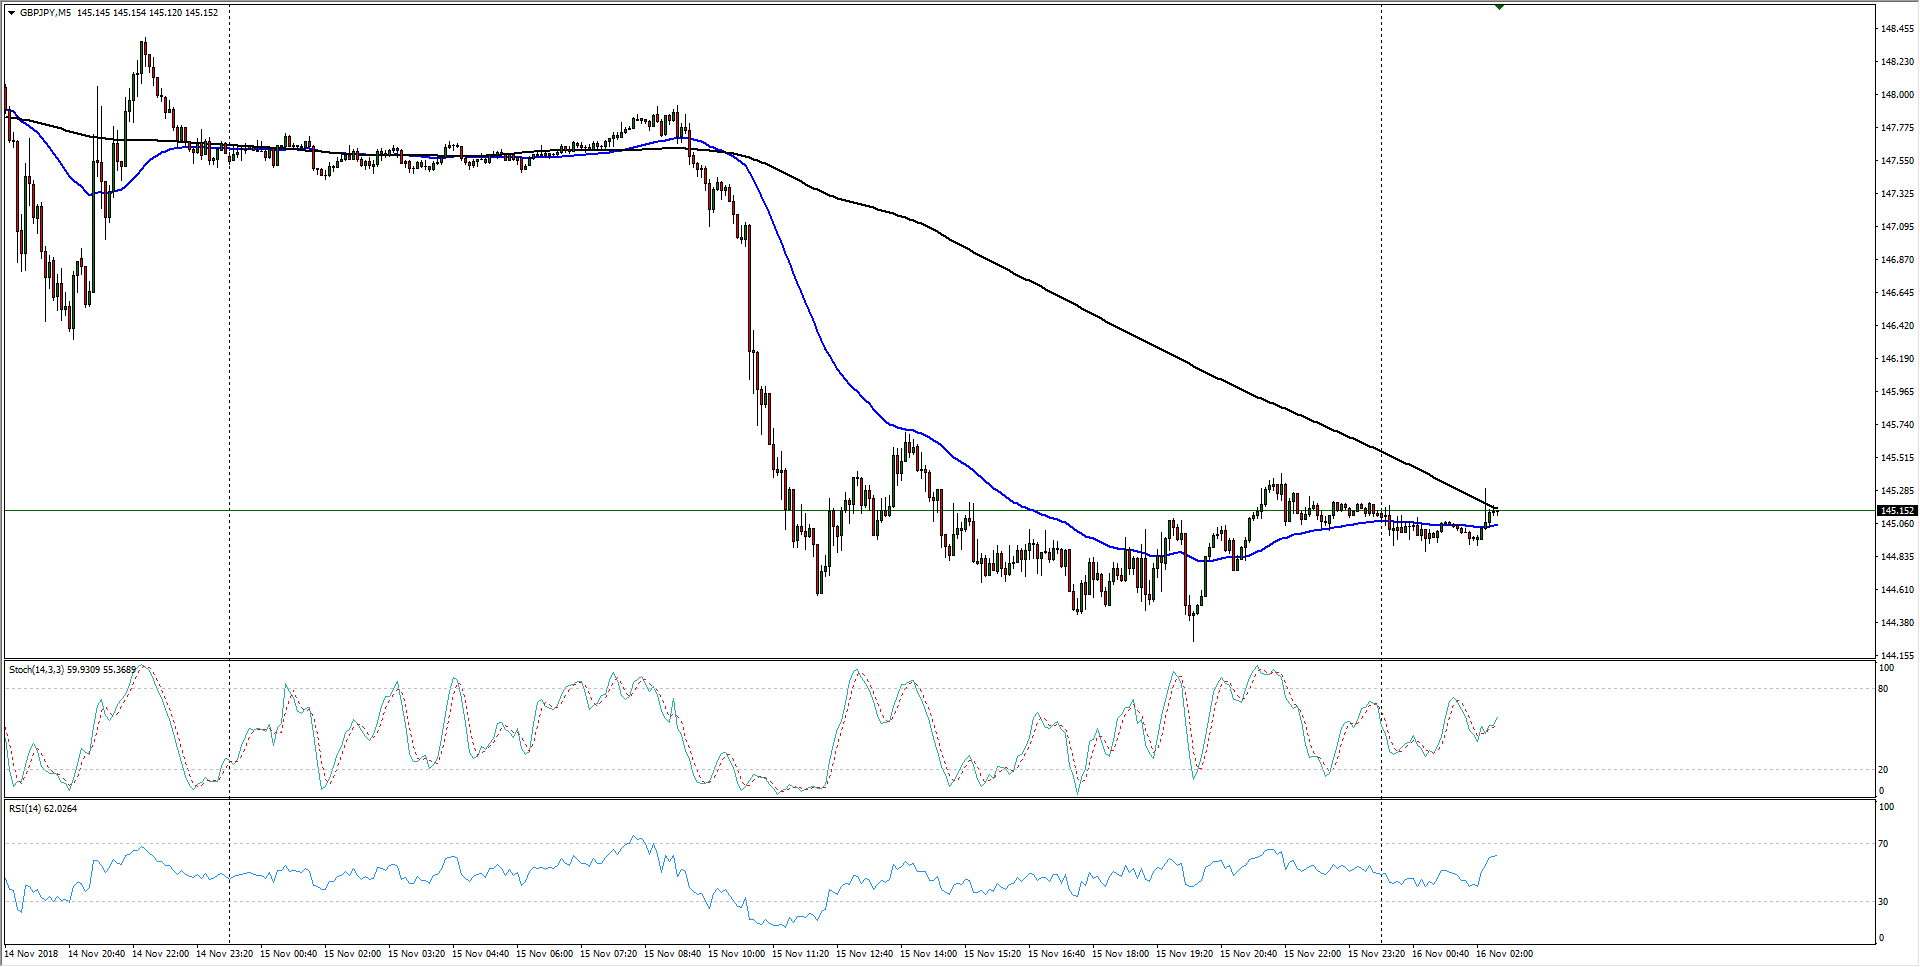
- The GBP/JPY 5-Minute candles have the pair struggling back up into near-term resistance from the 200-period moving average after a steep decline from Thursday's peaks near 147.95.
GBP/JPY Chart, 5-Minute
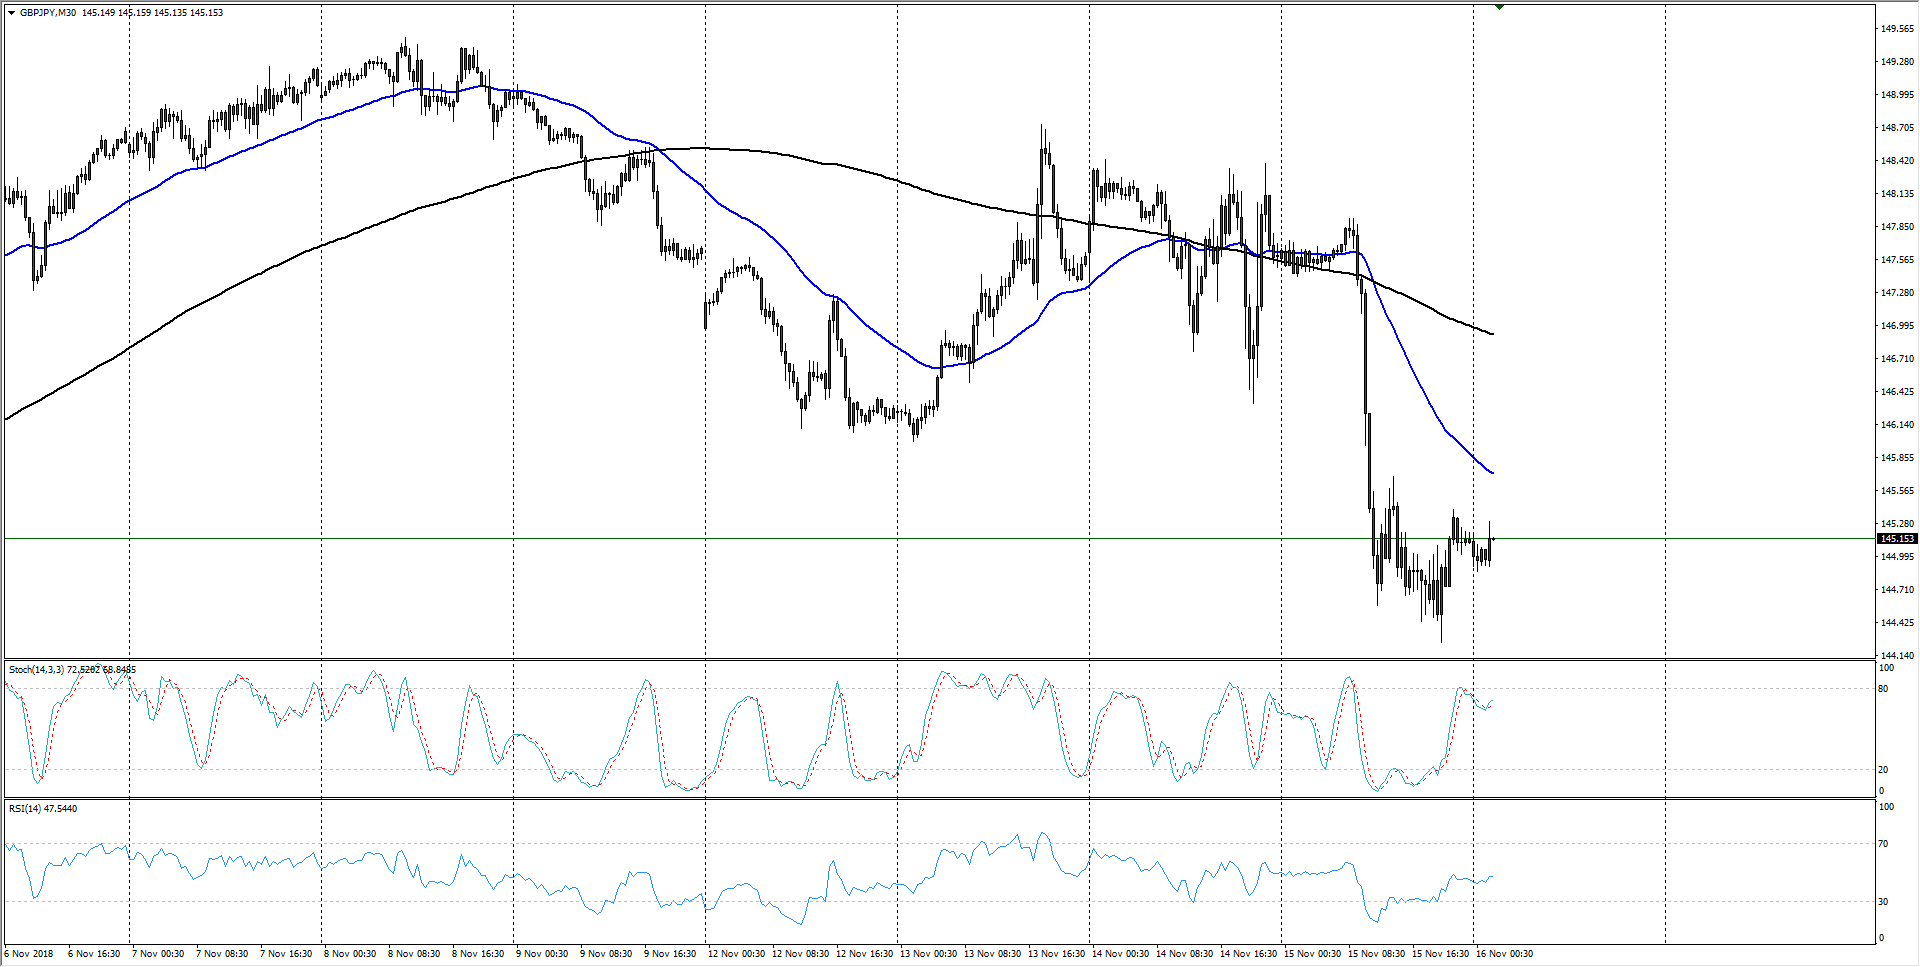
- The past week has seen the effects of constant Brexit headlines, with the Sterling whipping steadily from one end of the chart to the other, but flagging technical confidence leaves the Guppy trading into the low end, currently trapped in the 144.00 - 145.00 zone.
GBP/JPY Chart, 30-Minute
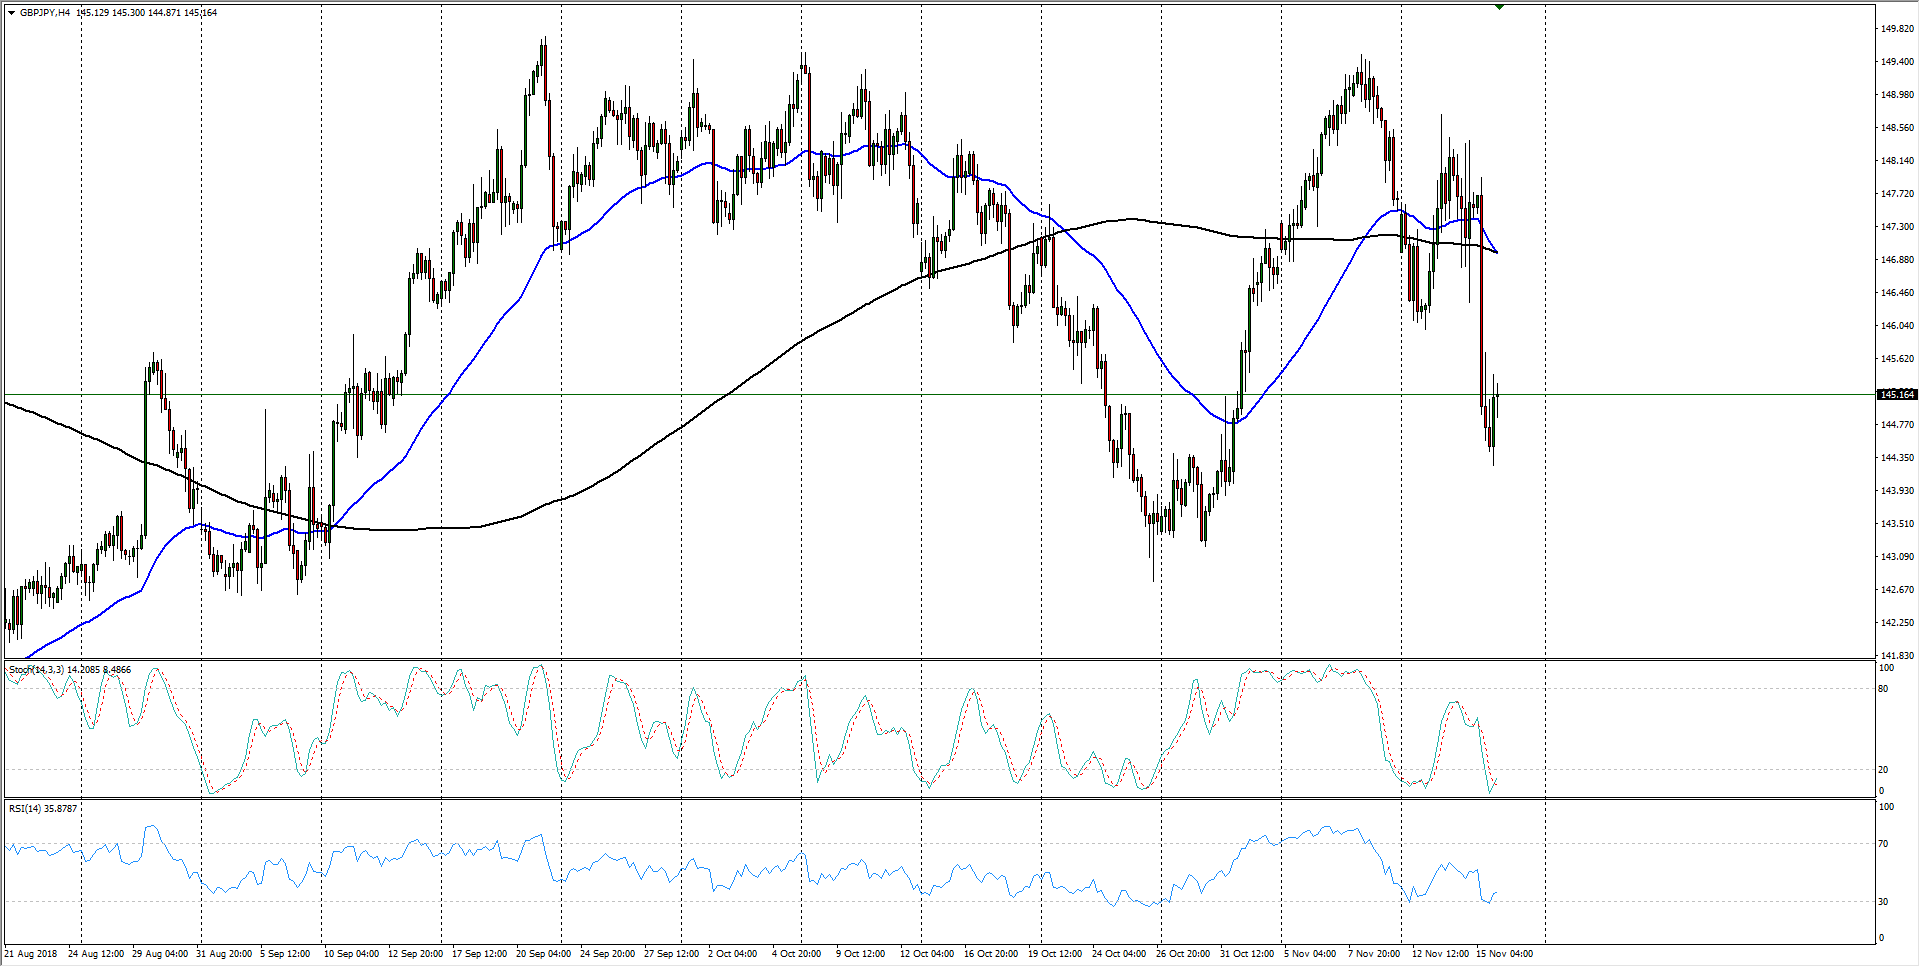
- The Guppy has been caught in a quickening pace of whipsaws on Brexit headlines, but remains constrained within a broad range from 142.50 to the 150.00 major handle, and directional indicators have gone sideways as the GBP/JPY spins around the 200-period moving average at 146.85.
GBP/JPY Chart, 4-Hour
GBP/JPY
Overview:
Last Price: 145.08
Daily change: -4.0 pips
Daily change: -0.0276%
Daily Open: 145.12
Trends:
Daily SMA20: 146.25
Daily SMA50: 146.99
Daily SMA100: 145.87
Daily SMA200: 147.25
Levels:
Daily High: 147.94
Daily Low: 144.26
Weekly High: 149.5
Weekly Low: 146.86
Monthly High: 149.52
Monthly Low: 142.78
Daily Fibonacci 38.2%: 145.66
Daily Fibonacci 61.8%: 146.53
Daily Pivot Point S1: 143.61
Daily Pivot Point S2: 142.09
Daily Pivot Point S3: 139.93
Daily Pivot Point R1: 147.29
Daily Pivot Point R2: 149.45
Daily Pivot Point R3: 150.97