NZD/USD Price Analysis: Edges lower past 0.6200 within monthly triangle
- NZD/USD consolidates the previous day’s recovery inside one-month-old symmetrical triangle.
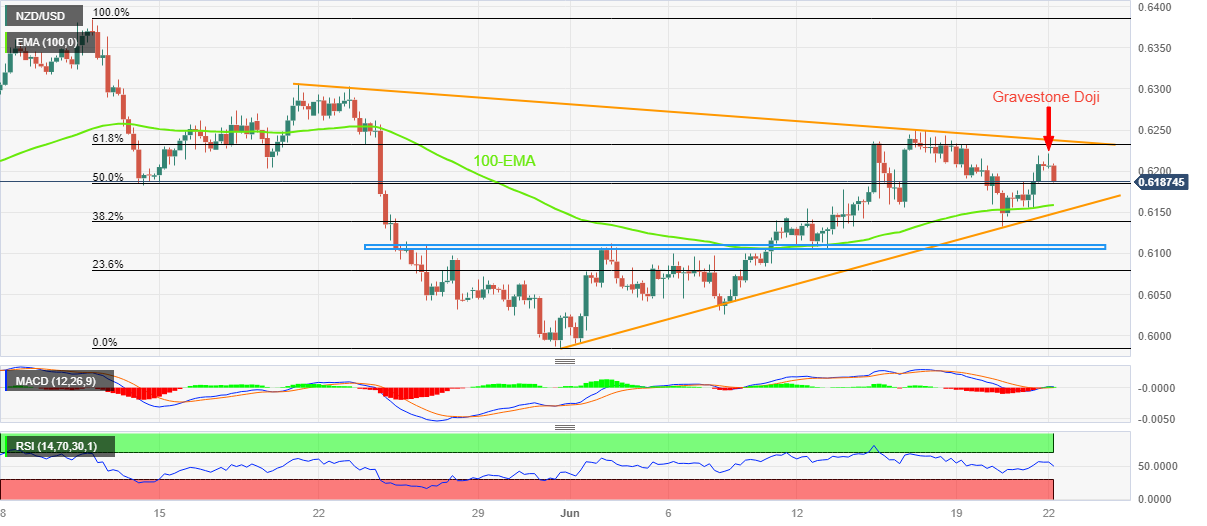
- Impending bull cross on MACD, sustained trading beyond 100-EMA keeps Kiwi buyers hopeful.
- Bears need to conquer 0.6200 to retake control, bulls can aim for 0.6310 on breakout.
NZD/USD clings to mild losses around 0.6190 as it reverses the previous day’s rebound heading into Thursday’s European session. In doing so, the Kiwi pair retreats within a one-month-old symmetrical triangle, funning down towards the breakout points of late.
That said, the early Thursday’s Gravestone Doji candlestick on the four-hour chart joins the downbeat sentiment to exert downside pressure on the NZD/USD price.
Suggesting another attempt to break the 100-bar Exponential Moving Average (EMA) surrounding 0.6155.
Following that, the stated triangle’s bottom line of near 0.6150 and a one-month-long horizontal support zone surrounding 0.6100 will lure the NZD/USD bears.
Meanwhile, the 61.8% Fibonacci retracement of its May 11-31 downside, near 0.6230, guards immediate upside of the NZD/USD pair, a break of which will highlight the aforementioned triangle’s top line, close to 0.6240 at the latest.
In a case where the Kiwi pair manages to remain firmer past 0.6240 the late May swing high of around 0.6310 can act as an extra filter towards the north before giving control to the bulls.
NZD/USD: Four-hour chart
Trend: Upside expected