Silver Price Analysis: XAG/USD climbs back closer to 100-day SMA support breakpoint
- Silver stages a solid rebound from over a two-month low touched this Friday.
- The setup warrants some caution before positioning for any further recovery.
- A sustained move beyond the $24.00 mark could negate the bearish outlook.
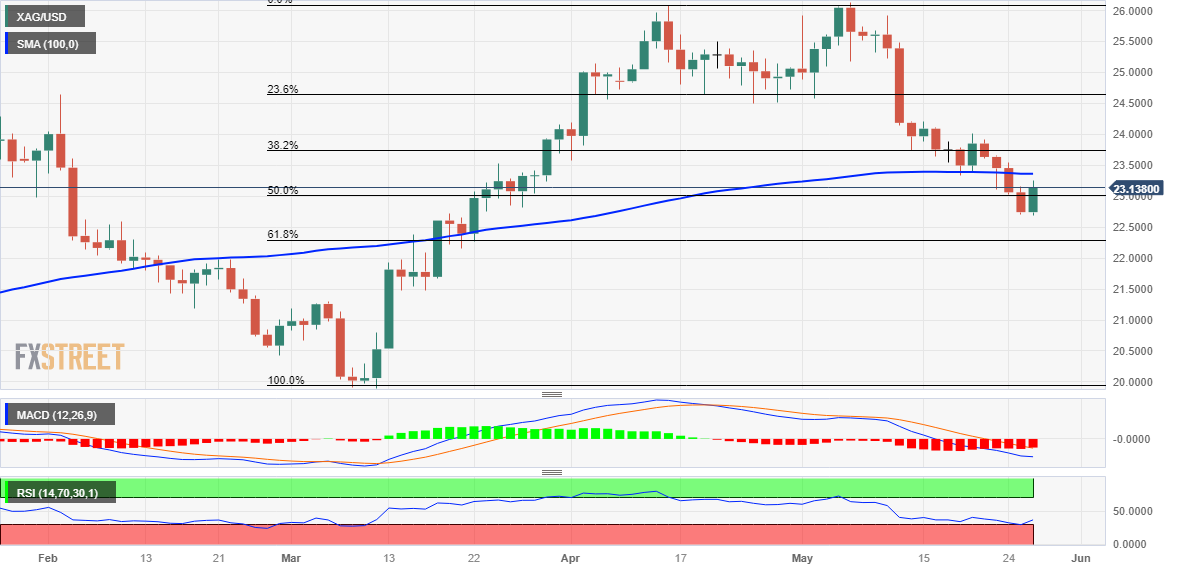
Silver gains strong positive traction on Friday and snaps a four-day losing streak to the $22.70-$22.65 area, or over a two-month low touched earlier today. The white metal maintains its bid tone through the early North American session and currently trades around the $23.20-$23.25 zone, up over 2% for the day.
A slightly oversold Relative Strength Index (RSI) on the daily chart turns out to be a key factor that prompts aggressive short-covering around the XAG/USD. That said, this week's convincing break through the 100-day Simple Moving Average (SMA) support and the overnight slide below the 50% Fibonacci retracement level of the March-May rally favour bearish traders. This, in turn, suggests that any subsequent move up might still be seen as a selling opportunity and runs the risk of fizzling out rather quickly.
The 100-day SMA support breakpoint, currently pegged around the $23.35 region, is likely to act as an immediate hurdle. This is followed by 38.2% Fibo. level, near the $23.75 zone, above which the XAG/USD could climb to the $24.00 mark. The latter should act as a pivotal point, which if cleared decisively might trigger a fresh wave of a short-covering move and lift the commodity further beyond the $24.20-$24.25 hurdle. The recovery momentum could get extended towards the $24.50-$24.60 strong support breakpoint.
On the flip side, the monthly low, around the $22.70-$22.65 region, now seems to protect the immediate downside ahead of the 61.8% Fibo. level, near the $22.25 area. Some follow-through selling, leading to a subsequent slide below the $22.00 mark should pave the way for an extension of the recent downfall from over a one-year top touched earlier this month. The XAG/USD might then accelerate the fall towards the $21.55-$21.50 intermediate support before eventually dropping to the $21.00 round-figure mark.
Silver daily chart

Key levels to watch
