NZD/USD Price Analysis: Kiwi limited while under 0.6350
- Volatility and erratic moves during the last trading session of the year.
- NZD/USD to end year with a 7.30% loss.
- The 0.6500 has the key to more gains for the Kiwi.
The NZD/USD is trading above 0.6300 during the last trading day of 2022. On a volatile session the pair hit the highest level in a week at 0.6373 and then pulled back to the 0.6330 zone.
The Kiwi is among the worst performers on Friday, on a volatile final trading day of 2022. For the year, the NZD lagged among commodity currencies, even after the recovery of the last quarter.
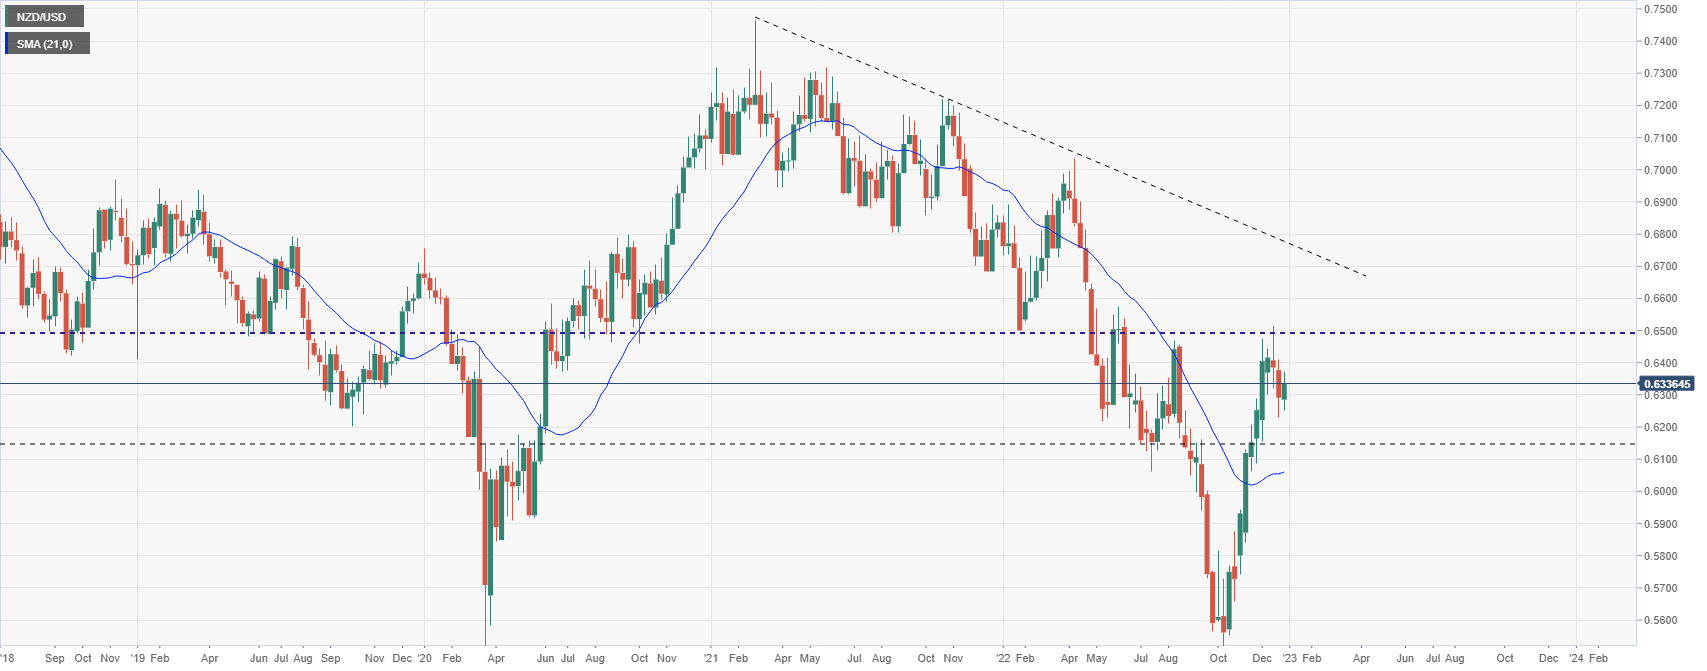
The NZD/USD bottomed during 2022 at 0.5512 in early October. It then started to recovery, trimming yearly losses. The upside move peaked slightly above 0.6500 two weeks ago. The 0.6500 area is a strong barrier that if broken should open the doors to more gains for the Kiwi.
The daily chart shows NZD/USD testing the 20-day Simple Moving Average that is hovering around 0.6350, a horizontal resistance area. While below, risks are tilted toward another test of the bottom of the current range at 0.6240. A daily close well above 0.6350 would point to further gains.
NZD/USD daily chart
-638080116958226339.png)
NZD/USD weekly chart

Technical levels
