EUR/JPY Price Analysis: Rising-wedge in the daily targeting a fall to 143.00
- EUR/JPY daily chart portrays the formation of a rising wedge with bearish implications.
- The EUR/JPY price action recoiled as the cross approached 146.00, suggesting a breakout is about to happen.
The EUR/JPY continues to consolidate within a rising wedge, though finished with minuscule losses of 0.04% on Tuesday, on a risk-on sentiment. As the Asian session begins, the EUR/JPY is trading at 145.48, barely gaining 0.01%.
EUR/JPY Price Analysis: Technical outlook
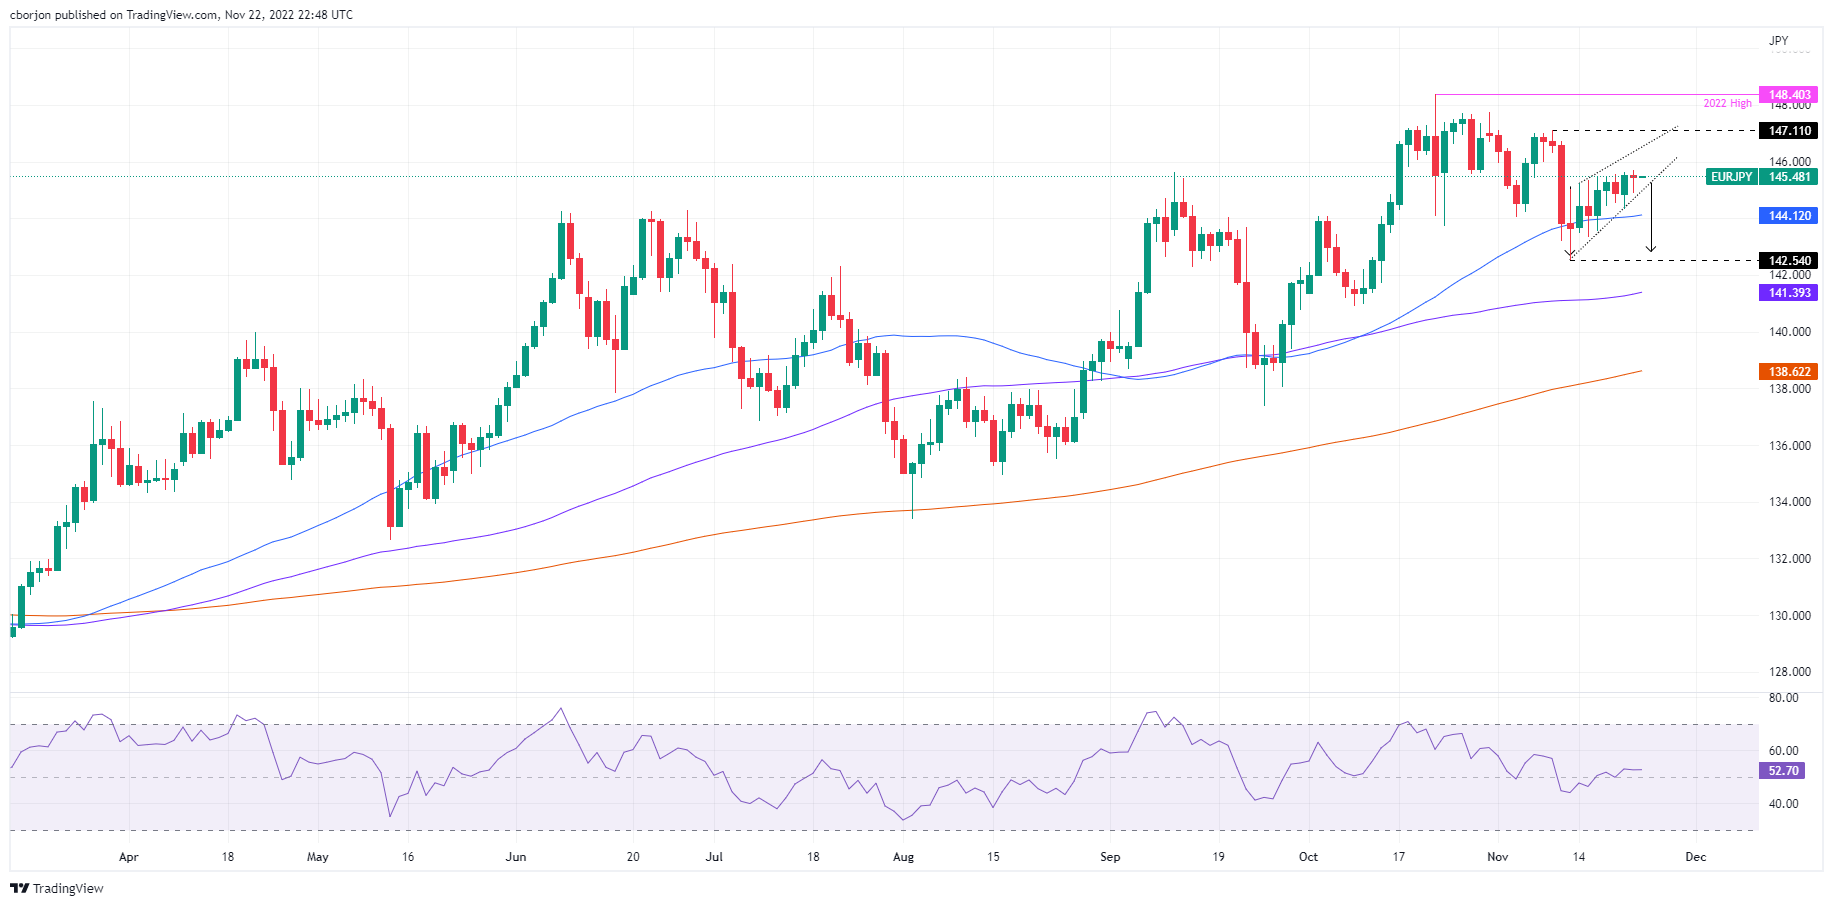
As above-mentioned, a rising wedge formed in the EUR/JPY daily chart, with most daily lows tracking the 50-day Exponential Moving Average (EMA) as a dynamic support. Although the cross continues to advance steadily, price action shrank during the last four trading days. That would mean the EUR/JPY is consolidating or a breakout is about to happen.
If the EUR/JPY clears 146.00, it could exacerbate a rally toward the year-to-day (YTD) highs around 148.40, but on its way north, buyers need to surpass some resistance levels. The first one would be the ascending-wedge top trendline around 146.50, followed by the November 9 daily high at 147.11. Once cleared, the psychological 148.00 is next.
Otherwise, if the EUR/JPY breaks below the rising wedge, the first support would be the 50-day EMA at 144.12. A breach of the latter will expose the 143.00 figure, followed by the November 11 swing low around 142.54.
EUR/JPY Key Technical Levels