Silver Price Analysis: 200-SMA challenges XAG/USD bears around $19.00
- Silver price pares intraday losses at the lowest level in one week.
- Weekly resistance line, bearish MACD signals challenge recovery moves.
- Oversold RSI, 61.8% Fibonacci retracement challenges immediate downside.
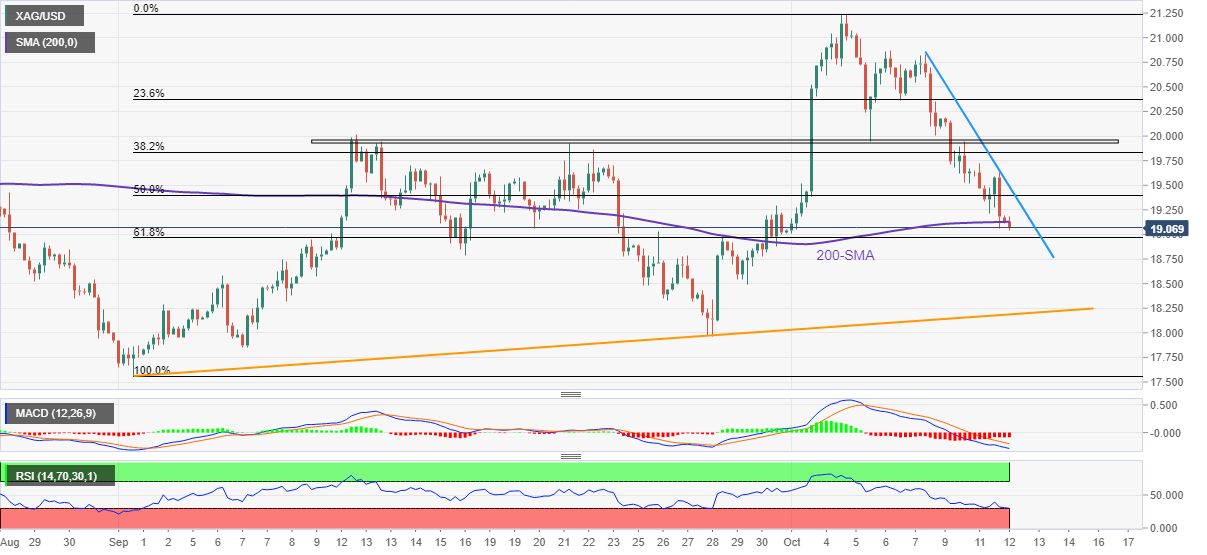
Silver price (XAG/USD) pauses the bearish momentum around a weekly low, following a three-day downtrend, as the 200-SMA joins nearly oversold RSI (14) to challenge bears. Even so, the quote struggles to defend the $19.00 threshold during Wednesday’s Asian session.
In doing so, the bright metal takes clues from the bearish MACD signals while also portraying the failure to cross a weekly descending trend line.
In addition to the 200-SMA level surrounding $19.00, the 61.8% Fibonacci retracement level of September-October upside, near $18.95, also challenges the XAG/USD bears.
If the commodity prices decline below $18.95, the odds of witnessing a slump toward a six-week-old support line near $18.20 can’t be ruled out.
Alternatively, recovery needs to cross the weekly resistance line, close to $19.50 at the latest, to convince the short-term silver buyers.
Even so, a one-month-old horizontal resistance area around $20.00 could challenge the XAG/USD upside.
Overall, the silver price may witness a corrective bounce but the bearish trend is likely to prevail.
Silver: Four-hour chart

Trend: Bearish
